- Caterpillar reported Q3 2023 earnings on Tuesday
- Sales and earnings beat analysts’ expectations
- Inventory build-up and drop in orders raise concerns over demand
- A look at the valuation with 3 popular models
- Stock drops to the lowest level since early-June 2023
Caterpillar (CAT.US), US manufacturer of heavy machinery, reported its latest earnings report on Tuesday, October 31 before opening of the Wall Street session. Report was solid but the stock has nevertheless dropped hard during the following session. Let’s take a closer look at Q3 2023 results from Caterpillar as well as the company’s valuation.
Solid results for Q3 2023
Earnings release from Caterpillar turned out to be solid. Revenue at $16.81 billion was higher than $16.6 billion expected and operating income of $3.45 billion was much higher than $3.09 billion expected. Company said that such good results were possible thanks to a mix of better pricing as well as higher sales volume. Price gains supported sales growth in all three key segments. Sales in North America increased 25% YoY while sales in Latin America declined 11% YoY. Caterpillar said that it expects a slightly higher Q4 2023 sales compared to Q4 2023. Adjusted operating margin is seen dropping quarter-over-quarter in Q4 2023
Q3 2023 results
- Revenue: $16.81 billion (+12% YoY)
- Construction Industries: $7.0 billion (11.1% YoY)
- Resources: $3.4 billion (+9% YoY)
- Energy & Transportations: $6.9 billion (+11% YoY)
- Operating profit: $3.45 billion (+42% YoY)
- Operating margin: 20.5%
- EPS: $5.45 (+41% YoY)
- Segment profit
- Construction Industries: $1.85 billion (+53% YoY)
- Resources: $0.73 billion (+44% YoY)
- Energy & Transportations: $1.18 billion (+26% YoY)
- Segment Profit Margin:
- Construction Industries: 26.4% vs 19.3% a year ago
- Resources: 21.8% vs 16.4% a year ago
- Energy & Transportations: 17.2% vs 15.1% a year ago
 Financial dashboard for Caterpillar. Source: Bloomberg Finance LP, XTB Research
Dealer inventories rise, order backlog shrinks
However, not everything is so rosy and there are some worrying points in Caterpillar’s Q3 results. While the company has managed to beat revenue and earnings expectations, it has also reported a $0.6 billion increase in dealer inventories for the third consecutive quarter. Combining this with a drop in $2.6 billion order backlog, we see a rather concerning mix hinting at a weakening demand for the company’s products. A continued pick-up in inventories may have an unfavorable impact on futures sales as will have to restock less often. However, the company’s CEO played down this trend saying that dealer inventories remain in the typical 3-4 month sale range and some dealers prefer to have more inventories of some products.
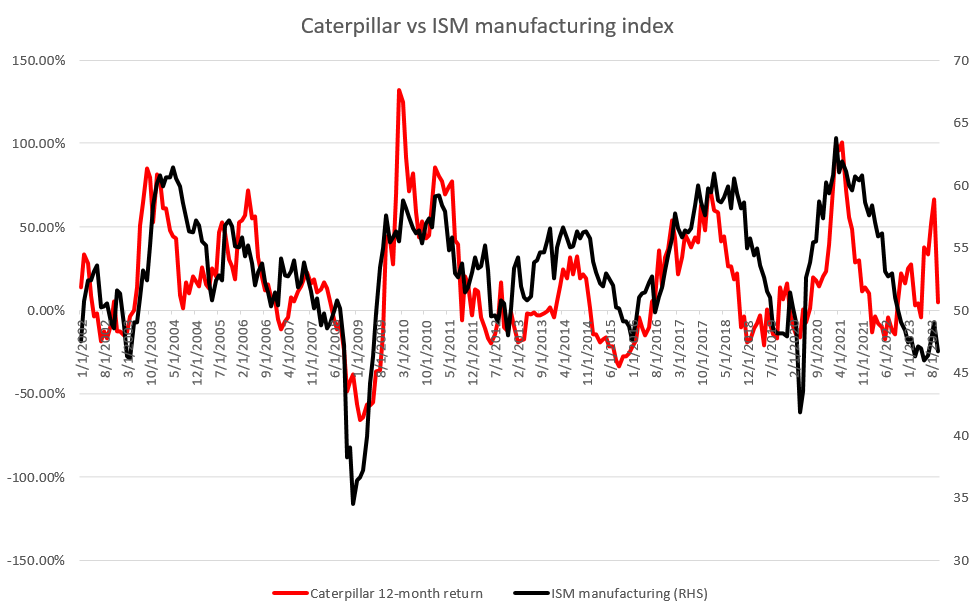
Company is seen as a bellwether for the global economy
Reports from Caterpillar are closely watched as the company’s position as leading construction machinery manufacturer makes it a bellwether not only for the US economy but also for the whole global economy. Taking a look at the chart below plotting 12-month returns for Caterpillar stock with manufacturing ISM readings, we can see that the correlation between the two is quite large. Moreover, we can see that reversals in Caterpillar’s return often precede reversal in ISM therefore performance of the company’s shares can sometimes be seen as a proxy for performance of the economy.
 Source: Bloomberg Finance LP, XTB Research
Valuation
Let’s take a quick look at McDonald’s valuation with 3 often used valuation methods – DCF, multiples and Gordon Growth Model. We want to stress that those valuations are for presentation purposes only and should not be viewed as recommendations or target prices.
Discounted Cash Flow method
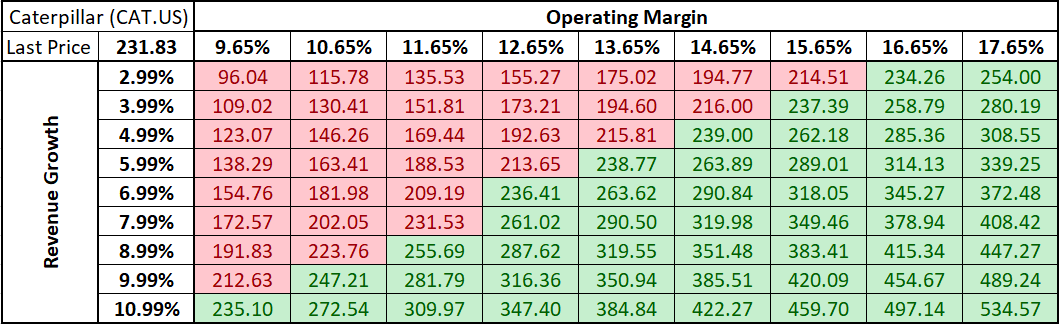
Let’s start with probably the most popular fundamental model for valuing stocks – Discounted Cash Flow method (DCF). This model relies on a number of assumptions. We have decided to take a simplified approach and base those assumptions on averages for the past 5-years. Detailed forecasts for 10 years were made with terminal value assumptions being set as follows – 3% terminal revenue growth and 7.6% terminal weighted cost of capital (WACC). Such a set of assumptions provides us with the intrinsic value of Caterpillar’s shares of $263.62 per share – over 13% above current market price!
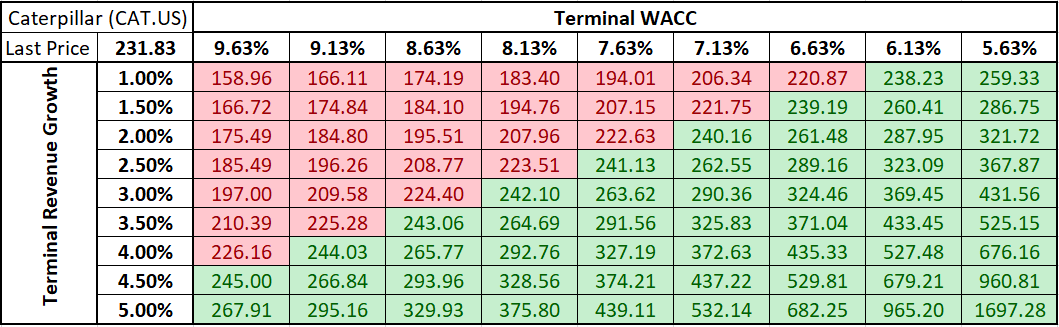
A point to note is that the intrinsic value obtained via the DCF method is highly sensitive to assumptions made. Two sensitivity matrices are provided below – one for different sets of Operating Margin and Revenue Growth assumptions and the other for different sets of Terminal WACC and Terminal Revenue Growth assumptions.
 Source: Bloomberg Finance LP, XTB Research
 Source: Bloomberg Finance LP, XTB Research
Multiples
Next, let’s take a look at how Caterpillar’s valuation compares with peers. We have constructed a peer group consisting of Deere & Co, 3M, Cummins Inc and Mitsubishi Heavy Industries – 4 key, public competitors to Caterpillar. We have taken a look at 6 different valuation multiples – P/E, P/BV, P/S, P/FCF, EV/Sales and EV/EBITDA.
Taking a look at the table below we can see that there is some volatility in multiples for Caterpillar peers, especially in the case of P/FCF multiple. Using median multiples provides us with valuation ranging from $148.94 in case of EV/sales multiple to $336.46 in case of P/FCF multiple. A trimmed mean (excluding the highest and lowest valuations) provides us with an intrinsic value of $185.46 per share, or around 20% below yesterday’s closing price.
 Source: Bloomberg Finance LP, XTB Research
Gordon Growth Model
As a company with a long track record of dividend payouts and 30 years of consecutive dividend increases, Caterpillar can be valued used a Gordon Growth Model – valuation method based on dividends. We have assumed an 8% dividend growth rate as well as 10% required rate of return based on averages and trends for the past 5-years. Running a model with such assumptions leads us to an intrinsic value of $254.34 per share, or almost 10% above yesterday’s closing price.
As it is usually the case with valuation models, the Gordon Growth Model is also highly sensitive to assumptions made. Sensitivity matrix for dividend growth and required rate of return assumptions is provided below. Green tiles show combinations that result in above-market valuation and red tiles show combinations that result in below-market valuations.
 Source: Bloomberg Finance LP, XTB Research
A look at the chart
Last but not least, let’s take a look at Caterpillar chart (CAT.US) at D1 interval. We can see that the stock broke below 200-session moving average (purple line) as well as 38.2% retracement of a year-long upward move last week. Earnings release this week provided more fuel for the sell-off with stock slumping over 6% on Tuesday and dropping to the levels not seen since early-June 2023. While declines were halted at the support zone ranging around 50% retracement, it should be noted that the stock dropped below the lower limit of the Overbalance structure which, at least in theory, signals a bearish trend reversal.
 Source: xStation5