- Silver attracts fresh buyers on Thursday and snaps a three-day losing streak to over a one-week low.
- The mixed technical setup warrants caution for bulls and before positioning for any further move-up.
- Acceptance below the 38.2% Fibo. might prompt technical selling and pave the way for deeper losses.
Silver (XAG/USD) builds on the previous day’s bounce from the vicinity of mid-$22.00s, or over a one-week low and scales higher through the early part of the European session on Thursday. The white metal, for now, seems to have snapped a three-day losing streak and currently trades around the $23.00 round figure, up nearly 1% for the day.
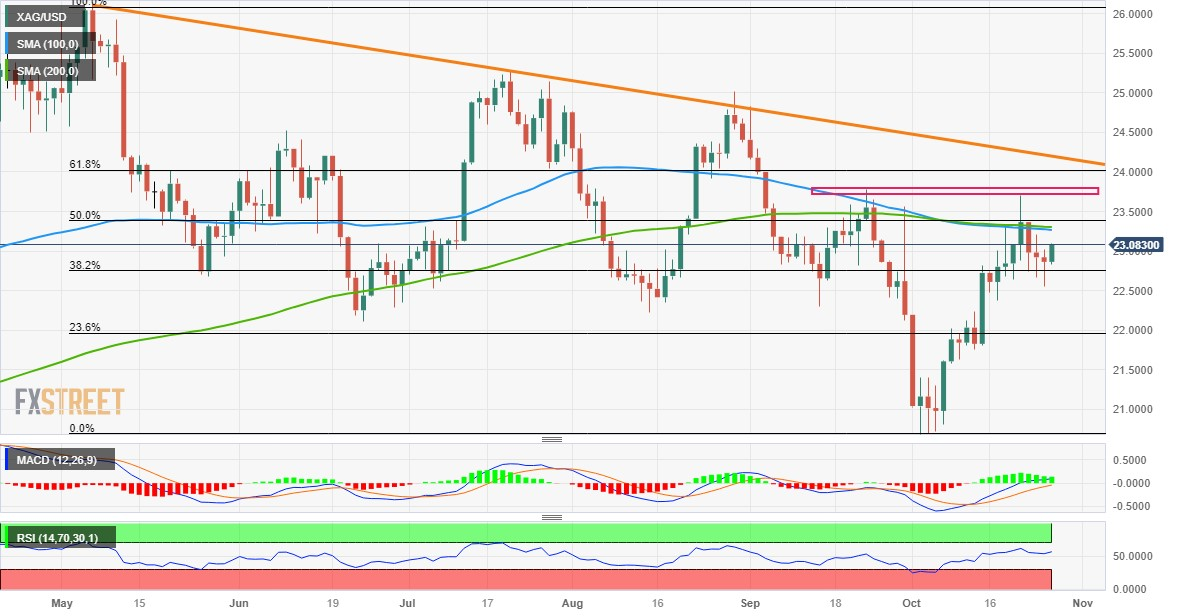
From a technical perspective, the XAG/USD has been showing some resilience below the 38.2% Fibonacci retracement level of the May-October slide. Moreover, oscillators on the daily chart are holding in the positive territory and support prospects for a further appreciating move. That said, any subsequent move up is more likely to confront stiff resistance near the $23.30-$23.40 confluence, comprising the 50% Fibo. level, the 100-day and 200-day Simple Moving Averages (SMAs).
This is followed by the $23.70-$23.75 strong horizontal barrier, above which a bout of a short-covering move could lift the XAG/USD towards the $24.00 mark, which coincides with the 61.8% Fibo. level. Some follow-through buying will expose a descending trend-line hurdle extending from the May high, currently pegged around the $24.20 region. A convincing breakout through the latter will be seen as a fresh trigger for bullish traders and set the stage for some meaningful upside.
On the flip side, the 38.2% Fibo. level, around the $22.75 area, now seems to protect the immediate downside ahead of the overnight swing low, near the $22.55 zone. Failure to defend the said support levels might prompt some technical selling and drag the XAG/USD to the $22.30-$22.25 horizontal resistance breakpoint now turned support. The downward trajectory could get extended further towards the $22.00 round-figure mark, representing 23.6% Fibo. level.
Silver daily chart
Technical levels to watch
XAG/USD
| OVERVIEW |
|---|
| Today last price | 23.07 |
| Today Daily Change | 0.21 |
| Today Daily Change % | 0.92 |
| Today daily open | 22.86 |
| TRENDS |
|---|
| Daily SMA20 | 22.22 |
| Daily SMA50 | 22.96 |
| Daily SMA100 | 23.28 |
| Daily SMA200 | 23.31 |
| LEVELS |
|---|
| Previous Daily High | 23.02 |
| Previous Daily Low | 22.56 |
| Previous Weekly High | 23.7 |
| Previous Weekly Low | 22.37 |
| Previous Monthly High | 24.82 |
| Previous Monthly Low | 22.12 |
| Daily Fibonacci 38.2% | 22.73 |
| Daily Fibonacci 61.8% | 22.84 |
| Daily Pivot Point S1 | 22.6 |
| Daily Pivot Point S2 | 22.35 |
| Daily Pivot Point S3 | 22.14 |
| Daily Pivot Point R1 | 23.07 |
| Daily Pivot Point R2 | 23.28 |
| Daily Pivot Point R3 | 23.54 |