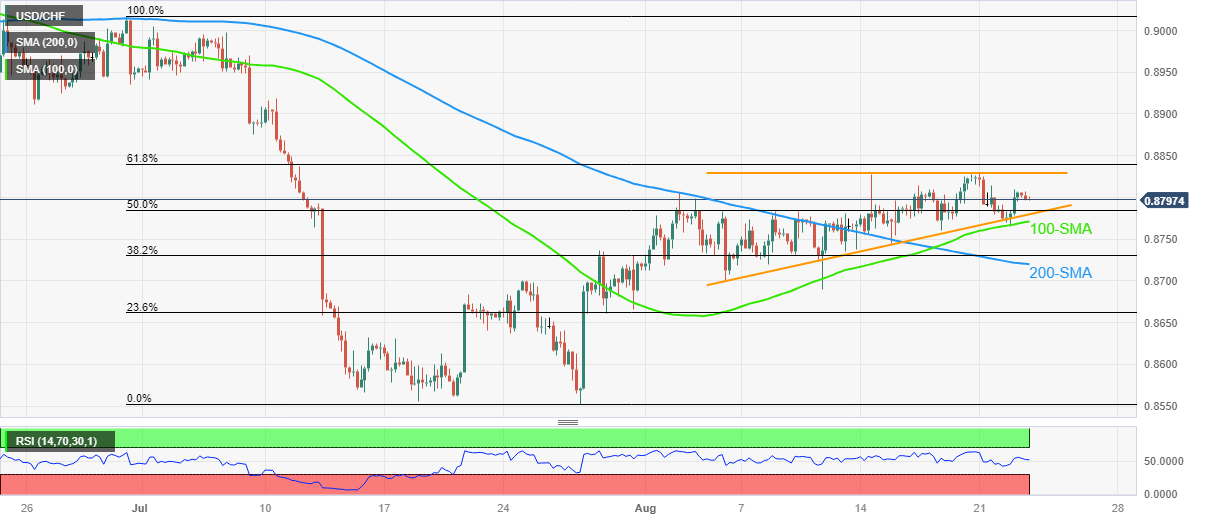
- USD/CHF fades bounce off 100-SMA as traders await US S&P Global PMIs for August.
- Fortnight-old ascending triangle restricts immediate moves of Swiss Franc pair.
- Steady RSI, failure to defend recovery from key SMA lure pair sellers.
- 200-SMA acts as additional check for bears; buyers need validation from “Golden Fibonacci Ratio”.
USD/CHF languishes around 0.8800 as it fades the previous day’s rebound from the 100-SMA heading into Wednesday’s European session. In doing so, the Swiss Franc (CHF) pair portrays the market’s cautious mood ahead of the preliminary readings of the August month Purchasing Managers Indexes (PMIs) for the US.
In addition to retreating towards the 100-SMA level of around 0.8780, the steady RSI (14) line and the existence of a 13-day-long rising triangle formation, currently between 0.8770 and 0.8830, also keep the USD/CHF sellers hopeful.
On a clear downside break of the 0.8770 mark, the Swiss Franc (CHF) pair sellers could aim for the 200-SMA support of 0.8720 before rushing toward the theoretical target of the triangle breakdown, around 0.8650.
Meanwhile, USD/CHF rebound needs to cross the top line of the aforementioned triangle, close to 0.8830, to convince intraday buyers.
Even so, the 61.8% Fibonacci retracement of the pair’s late June–July downside, near 0.8840, will act as the final defense of the pair bears.
Overall, the USD/CHF is likely to remain bearish unless crossing 0.8840. However, the downside move should draw support from the softer US S&P Global PMIs for August, as well as dovish Fed concerns, to dominate further.
USD/CHF: Four-hour chart

Trend: Limited downside expected
ADDITIONAL IMPORTANT LEVELS
| OVERVIEW |
|---|
| Today last price | 0.88 |
| Today Daily Change | -0.0004 |
| Today Daily Change % | -0.05% |
| Today daily open | 0.8804 |
| TRENDS |
|---|
| Daily SMA20 | 0.8754 |
| Daily SMA50 | 0.8805 |
| Daily SMA100 | 0.8897 |
| Daily SMA200 | 0.9094 |
| LEVELS |
|---|
| Previous Daily High | 0.8809 |
| Previous Daily Low | 0.8765 |
| Previous Weekly High | 0.8828 |
| Previous Weekly Low | 0.8738 |
| Previous Monthly High | 0.9005 |
| Previous Monthly Low | 0.8552 |
| Daily Fibonacci 38.2% | 0.8793 |
| Daily Fibonacci 61.8% | 0.8782 |
| Daily Pivot Point S1 | 0.8777 |
| Daily Pivot Point S2 | 0.8749 |
| Daily Pivot Point S3 | 0.8733 |
| Daily Pivot Point R1 | 0.8821 |
| Daily Pivot Point R2 | 0.8837 |
| Daily Pivot Point R3 | 0.8865 |