- NZD/USD pierces 10-DMA hurdle amid nearly oversold RSI, ignores mixed NZ Retail Sales details.
- Kiwi bulls need to cross 0.5980-85 resistance region to retake control.
- US S&P Global PMI for August also need to back the recovery moves within short-term falling wedge.
NZD/USD struggles to defend the previous day’s run-up as it prods the 100-DMA resistance amid early Wednesday morning in Europe. In doing so, the Kiwi pair justifies the market’s dilemma amid mixed New Zealand Retail Sales data and the US Dollar’s retreat ahead of the key US PMIs for August. That said, the quote seesaws around 0.5950 by the press time.
As per Statistics New Zealand, the Pacific major’s Retail Sales improved during the second quarter (Q2) of 2023. On the same line could be the comments from Reserve Bank of New Zealand (RBNZ) Chief Economist Paul Conway. However, the Retail Sales ex Autos, also known as the Core Retail Sales, marked downbeat print and challenges the national growth concerns, as well as the Kiwi pair buyers.
On the contrary, the US Dollar Index (DXY) retreats from the 10-week high marked the previous day to around 103.50 at the latest.
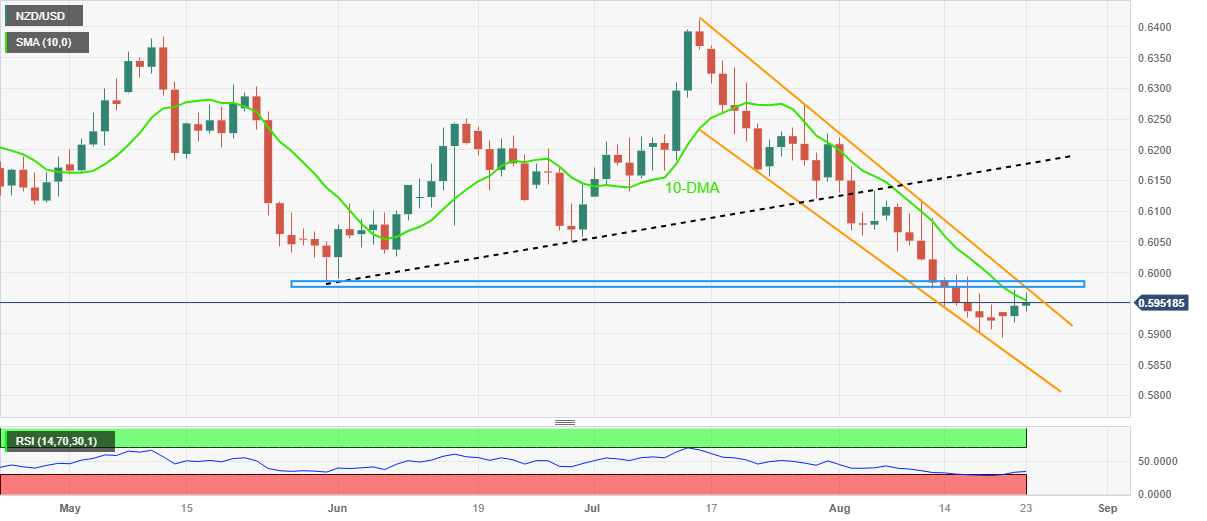
Technically, the nearly oversold RSI (14) line allows the NZD/USD traders to pare recent losses while bouncing off the yearly low.
Though, a convergence of May’s low and the top line of a five-week-long falling wedge bullish chart formation, around 0.5980-85, appears a tough nut to crack for the Kiwi pair buyers.
On the flip side, the Year-To-Date (YTD) low marked on Monday around 0.5895 restricts the short-term downside of the NZD/USD pair.
Following that, the aforementioned wedge’s bottom line, close to 0.5850, will be in the spotlight.
To sum up, NZD/USD stays in recovery mode but the pair’s further upside appears difficult unless gaining strong fundamental support.
NZD/USD: Daily chart
Trend: Limited recovery expected
ADDITIONAL IMPORTANT LEVELS
| OVERVIEW |
|---|
| Today last price | 0.595 |
| Today Daily Change | 0.0004 |
| Today Daily Change % | 0.07% |
| Today daily open | 0.5946 |
| TRENDS |
|---|
| Daily SMA20 | 0.6048 |
| Daily SMA50 | 0.6142 |
| Daily SMA100 | 0.6162 |
| Daily SMA200 | 0.623 |
| LEVELS |
|---|
| Previous Daily High | 0.5973 |
| Previous Daily Low | 0.5918 |
| Previous Weekly High | 0.5997 |
| Previous Weekly Low | 0.5903 |
| Previous Monthly High | 0.6413 |
| Previous Monthly Low | 0.612 |
| Daily Fibonacci 38.2% | 0.5952 |
| Daily Fibonacci 61.8% | 0.5939 |
| Daily Pivot Point S1 | 0.5918 |
| Daily Pivot Point S2 | 0.5891 |
| Daily Pivot Point S3 | 0.5863 |
| Daily Pivot Point R1 | 0.5973 |
| Daily Pivot Point R2 | 0.6001 |
| Daily Pivot Point R3 | 0.6028 |