- NZD/USD clings to mild gains defends late Monday’s rebound from YTD low.
- Upside break of two-week-old descending resistance line, bullish MACD signals favor Kiwi bulls.
- 50-SMA, monthly trend line resistance prod pair buyers.
- Double bottoms around 0.5900 challenge NZD/USD bears from retaking control.
NZD/USD seesaws around intraday high surrounding 0.5940-35 heading into Tuesday’s European session.
In doing so, the Kiwi pair defends the previous day’s corrective bounce off the lowest level since November 2022, as well as an upside break of a fortnight-long resistance line. Adding strength to the upside bias are the bullish MACD signals.
With this, the NZD/USD buyers can consider the latest retreat as a buying opportunity while targeting the 50-SMA hurdle of 0.5960.
However, a downward-sloping resistance line from early August, around 0.5975 at the latest, restricts the Kiwi pair’s further upside.
It’s worth mentioning that multiple tops marked since August 11, close to 0.5995–6000 act as additional upside filters for the NZD/USD bulls.
Meanwhile, pullback moves remain elusive unless the quote stays beyond the two-week-old previous resistance line, near 0.5920 at the latest.
Following that, double bottoms marked around 0.5900 will act as crucial support to watch for the NZD/USD bears.
In a case where the Kiwi sellers dominate past 0.5900, an early October 2022 swing high of around 0.5815 will be on their radars.
NZD/USD: Four-hour chart
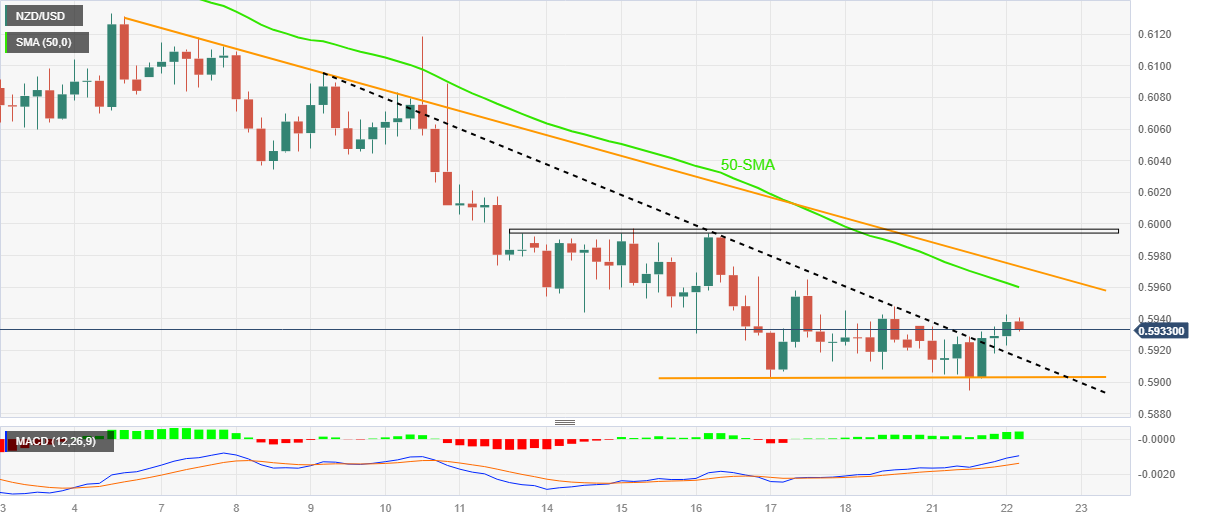
Trend: Further recovery expected
ADDITIONAL IMPORTANT LEVELS
| OVERVIEW |
|---|
| Today last price | 0.5936 |
| Today Daily Change | 0.0007 |
| Today Daily Change % | 0.12% |
| Today daily open | 0.5929 |
| TRENDS |
|---|
| Daily SMA20 | 0.6062 |
| Daily SMA50 | 0.6146 |
| Daily SMA100 | 0.6166 |
| Daily SMA200 | 0.6231 |
| LEVELS |
|---|
| Previous Daily High | 0.5936 |
| Previous Daily Low | 0.5895 |
| Previous Weekly High | 0.5997 |
| Previous Weekly Low | 0.5903 |
| Previous Monthly High | 0.6413 |
| Previous Monthly Low | 0.612 |
| Daily Fibonacci 38.2% | 0.591 |
| Daily Fibonacci 61.8% | 0.592 |
| Daily Pivot Point S1 | 0.5904 |
| Daily Pivot Point S2 | 0.5879 |
| Daily Pivot Point S3 | 0.5864 |
| Daily Pivot Point R1 | 0.5945 |
| Daily Pivot Point R2 | 0.596 |
| Daily Pivot Point R3 | 0.5985 |