- GBP/USD pair posts a modest gain near 1.2770, up 0.11% on the day.
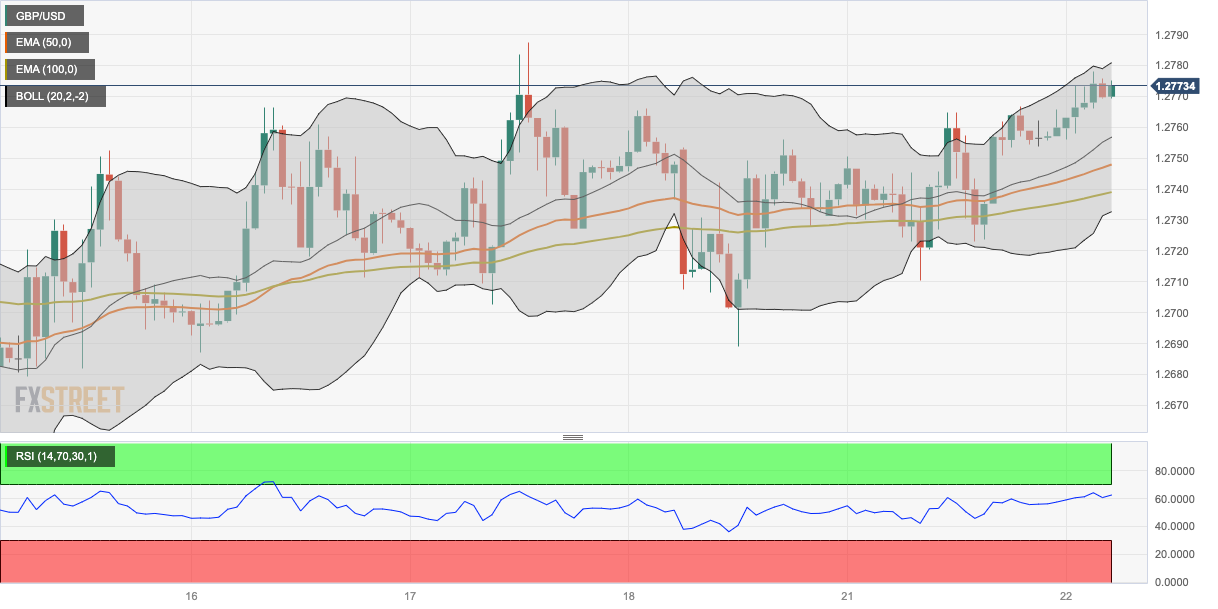
- GBP/USD holds above the 50- and 100-hour EMA; the Relative Strength Index (RSI) supports the buyers.
- The immediate resistance level is seen at 1.2780-1.2785 region; 1.2740 acts as an initial support level.
The GBP/USD pair gains momentum around 1.2770 heading into the European session on Tuesday. The pair trades in positive territory for the second day in a row amid the weakening of the Greenback. Meanwhile, the US Dollar Index (DXY), a measure of the value of USD against six other major currencies, drops to 103.22.
From the technical perspective, GBP/USD holds above the 50- and 100-hour Exponential Moving Averages (EMA) on the one-hour chart, which means further upside looks favorable. Meanwhile, the Relative Strength Index (RSI) stands above 50, within bullish territory, suggesting that buyers are likely to retain control in the near term.
Therefore, the major pair will meet the immediate resistance level of 1.2780-1.2785 region, representing the upper boundary of the Bollinger Band and a high of August 17. The additional upside filter is located at a psychological round figure of 1.2800. Further north, the next barrier is seen at 1.2840 (high of August 1) en route to 1.2888 (high of July 28).
On the flip side, any extended weakness below 1.2740 (100-hour EMA) will challenge the next contention at 1.2730 (the lower limit of the Bollinger Band). The key contention is located at 1.2700 (low of August 18 and a psychological figure).
GBP/USD one-hour chart
GBP/USD
| OVERVIEW |
|---|
| Today last price | 1.277 |
| Today Daily Change | 0.0014 |
| Today Daily Change % | 0.11 |
| Today daily open | 1.2756 |
| TRENDS |
|---|
| Daily SMA20 | 1.2763 |
| Daily SMA50 | 1.2793 |
| Daily SMA100 | 1.2632 |
| Daily SMA200 | 1.2384 |
| LEVELS |
|---|
| Previous Daily High | 1.2767 |
| Previous Daily Low | 1.271 |
| Previous Weekly High | 1.2788 |
| Previous Weekly Low | 1.2617 |
| Previous Monthly High | 1.3142 |
| Previous Monthly Low | 1.2659 |
| Daily Fibonacci 38.2% | 1.2745 |
| Daily Fibonacci 61.8% | 1.2732 |
| Daily Pivot Point S1 | 1.2722 |
| Daily Pivot Point S2 | 1.2688 |
| Daily Pivot Point S3 | 1.2666 |
| Daily Pivot Point R1 | 1.2778 |
| Daily Pivot Point R2 | 1.2801 |
| Daily Pivot Point R3 | 1.2835 |