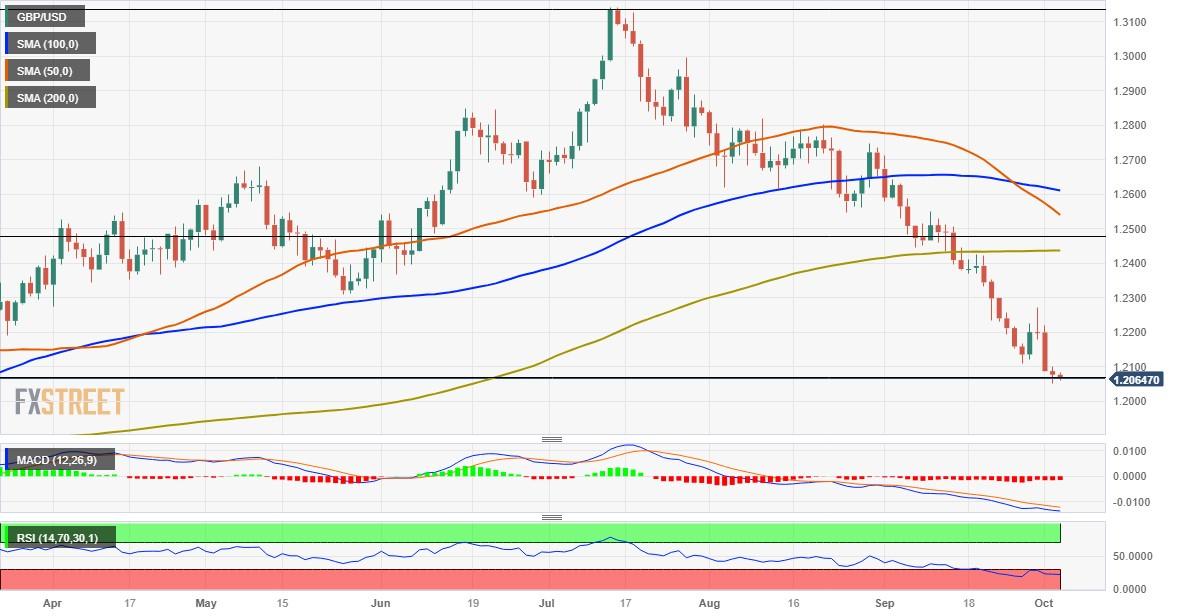
- GBP/USD is seen consolidating in a narrow band near a multi-month low touched on Tuesday.
- The extremely oversold RSI on the daily chart holds back bearish traders from placing fresh bets.
- The divergent Fed-BoE policy outlook supports prospects for an extension of the declining trend.
The GBP/USD pair struggles to register any meaningful recovery and languishes near its lowest level since March 16, around the 1.2050 area touched the previous day.
The prospects for further policy tightening by the Federal Reserve (Fed) remain supportive of elevated US Treasury bond yields and assist the US Dollar (USD) to stand tall near a 10-month high. This, along with the prevalent risk-off environment, is seen as another factor benefitting the Greenback’s relative safe-haven status. Apart from this, the Bank of England’s (BoE) surprise on-hold decision in September continues to undermine the British Pound (GBP) and acts as a headwind for the GBP/USD pair.
From a technical perspective, the Relative Strength Index (RSI) on the daily chart is flashing extremely oversold conditions and holding back traders from placing fresh bearish bets. Hence, it will be prudent to wait for some follow-through selling below mid-1.2000s, representing the 38.2% Fibonacci retracement level of the September 2022-July 2023 rally, before positioning for further losses. The GBP/USD pair might then accelerate the downfall further towards the 1.2000 psychological mark.
The next relevant support is pegged near the 1.1965 horizontal zone, which if broken decisively will be seen as a fresh trigger for bearish traders. The subsequent downfall has the potential to drag spot prices further towards the 1.1915 region en route to the 1.1900 mark. The GBP/USD pair could eventually drop to the 1.1800 neighbourhood, or the YTD low touched in March, en route to the 50% Fibo. level support near the 1.1740-1.1735 area.
On the flip side, any meaningful recovery beyond the 1.2100 mark is likely to confront a stiff hurdle near the 1.2140-1.2145 zone. A sustained strength beyond, however, could trigger a short-covering rally and allow the GBP/USD pair to reclaim the 1.2200 round figure. The momentum could get extended further, though might still be seen as a selling opportunity and runs the risk of fizzling out rather quickly near the last week’s swing high, around the 1.2270 region.
GBP/USD daily chart

Technical levels to watch
GBP/USD
| OVERVIEW |
|---|
| Today last price | 1.2066 |
| Today Daily Change | -0.0011 |
| Today Daily Change % | -0.09 |
| Today daily open | 1.2077 |
| TRENDS |
|---|
| Daily SMA20 | 1.2323 |
| Daily SMA50 | 1.2557 |
| Daily SMA100 | 1.2615 |
| Daily SMA200 | 1.2437 |
| LEVELS |
|---|
| Previous Daily High | 1.2102 |
| Previous Daily Low | 1.2052 |
| Previous Weekly High | 1.2272 |
| Previous Weekly Low | 1.2111 |
| Previous Monthly High | 1.2713 |
| Previous Monthly Low | 1.2111 |
| Daily Fibonacci 38.2% | 1.2071 |
| Daily Fibonacci 61.8% | 1.2083 |
| Daily Pivot Point S1 | 1.2052 |
| Daily Pivot Point S2 | 1.2028 |
| Daily Pivot Point S3 | 1.2003 |
| Daily Pivot Point R1 | 1.2102 |
| Daily Pivot Point R2 | 1.2127 |
| Daily Pivot Point R3 | 1.2151 |