- Gold Price renews two-week high as bulls cheer sooner end of hawkish monetary policies.
- Downbeat activity data recalls challenges for “higher for longer” rates, fueling XAU/USD amid upbeat sentiment.
- China-linked optimism adds strength to the Gold Price rebound despite cautious mood ahead of key central bankers’ speeches.
- Jackson Hole Symposium gains additional importance as hawks are challenged by recent PMI.
Gold Price (XAU/USD) rises to the highest levels in two weeks, up for the fifth consecutive day, as bulls cheer receding fears of higher rates ahead of top-tier US data and central bankers’ speech at the annual Jackson Hole Symposium event.
The recent downbeat Purchasing Managers Index (PMI) data for August from the developed economies, including the US, restored the market’s previous concerns about the central bank policy pivot and weighed on the Greenback, which in turn fuelled the Gold Price.
Additionally, expectations that the diplomatic ties between China and the US will improve also allowed the XAU/USD to remain firmer due to Beijing’s status as one of the world’s top Gold customers.
Elsewhere, the US Dollar’s sluggish move and the market’s optimism, backed by the technology stocks, as well as a pullback in the US Treasury bond yields from the multi-year high add strength to the Gold price run-up.
However, a slew of US data remains to be published and can test the XAU/USD bulls. Above all, Fed Chairman Jerome Powell’s defense of the hawkish monetary policy will be crucial to watch for clear directions as the latest US data suggest the nearness to the end of the rate hike cycle, which if confirmed could weigh on the US Dollar and favor the Gold buyers.
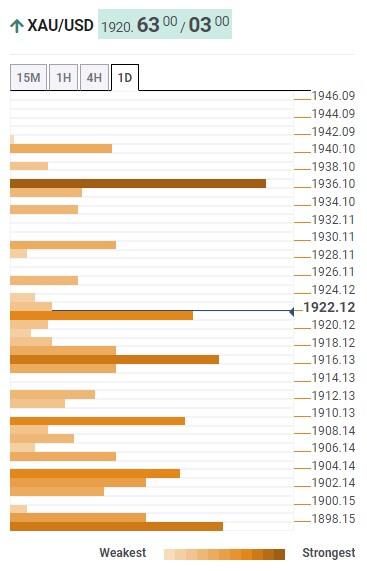
Gold Price: Key levels to watch
Our Technical Confluence indicator shows that the Gold Price stays well beyond the short-term key resistances, now support, while approaching the key $1,938 resistance confluence comprising Fibonacci 61.8% on one-month and 161.8% on one-week.
Before that, Pivot point one-week R2, near $1,930, may test the XAU/USD buyers.
It’s worth noting that Pivot Point one-week R3 acts as an extra upside filter around $1,942.
That said, the previous weekly high joins the middle band of the Bollinger on the hours chart and Pivot Point one-month S1 to highlight $1,916 as an immediate support.
Following that, the 200-DMA and Pivot Point one-week R1 appears a tough nut to crack for the Gold sellers around $1,910.
Above all, the XAU/USD buyers remain on the table unless witnessing a sustained downside break of the $1,898 support confluence comprising the 5-DMA and Fibonacci 38.2% on one-week.
Here is how it looks on the tool
About Technical Confluences Detector
The TCD (Technical Confluences Detector) is a tool to locate and point out those price levels where there is a congestion of indicators, moving averages, Fibonacci levels, Pivot Points, etc. If you are a short-term trader, you will find entry points for counter-trend strategies and hunt a few points at a time. If you are a medium-to-long-term trader, this tool will allow you to know in advance the price levels where a medium-to-long-term trend may stop and rest, where to unwind positions, or where to increase your position size.