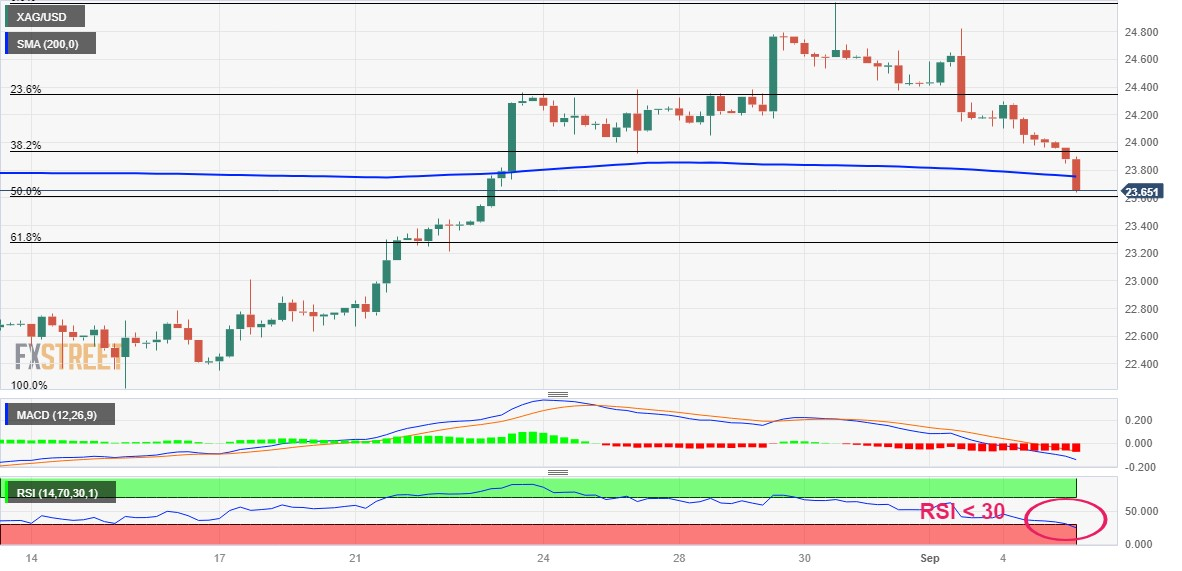
- Silver remains under heavy selling pressure for the fifth straight day on Tuesday.
- A sustained break below the 200-period SMA on the 4-hour chart favours bears.
- The oversold RSI on hourly charts makes it prudent to wait for some consolidation.
Silver prolongs last week’s rejection slide from the $25.00 psychological mark, or over a one-month peak and continues to lose ground for the fifth successive day on Tuesday. The downfall remains uninterrupted through the early European session and drags the white metal to a two-week low, around the $23.65 region in the last hour.
From a technical perspective, sustained break and acceptance below the $23.80-$23.75 area, representing the 200-period Simple Moving Average (SMA) on the 4-hour chart could be seen as a fresh trigger for bearish traders. Moreover, oscillators on the daily chart have just started gaining negative traction and support prospects for a further near-term depreciating move. That said, the Relative Strength Index (RSI) on hourly charts is flashing oversold conditions and might assist the XAG/USD to consolidate near current levels, representing the 50% Fibonacci retracement level of $22.25-$25.00 rally.
A convincing break below, however, will make silver vulnerable to accelerate the fall towards the 61.8% Fibo. level, around the $23.30-$23.25 region en route to the $23.00 round-figure mark. The downward trajectory could get extended further and drag the XAG/USD further below the $22.65-$22.60 area, towards challenging a strong horizontal support near the $22.20-$22.10 zone.
On the flip side, the 200-period SMA breakpoint, around the $23.75-$23.80 region, now seems to act as an immediate barrier ahead of the $24.00 round-figure mark. The latter represents the 38.2% Fibo. level, above which a bout of a short-covering move has the potential to lift the XAG/USD towards the 23.6% Fibo. level, around the $24.30-$24.35 area. Some follow-through buying might expose a four-month-old descending trend line resistance, currently near the $24.70-$24.75 zone. A sustained breakthrough, leading to a subsequent strength beyond the $25.00 mark, might shift the bias in favour of bullish traders.
Silver 4-hour chart

Technical levels to watch
XAG/USD
| OVERVIEW |
|---|
| Today last price | 23.68 |
| Today Daily Change | -0.32 |
| Today Daily Change % | -1.33 |
| Today daily open | 24 |
| TRENDS |
|---|
| Daily SMA20 | 23.47 |
| Daily SMA50 | 23.7 |
| Daily SMA100 | 23.92 |
| Daily SMA200 | 23.44 |
| LEVELS |
|---|
| Previous Daily High | 24.3 |
| Previous Daily Low | 23.96 |
| Previous Weekly High | 25.02 |
| Previous Weekly Low | 24.05 |
| Previous Monthly High | 25.02 |
| Previous Monthly Low | 22.23 |
| Daily Fibonacci 38.2% | 24.09 |
| Daily Fibonacci 61.8% | 24.17 |
| Daily Pivot Point S1 | 23.88 |
| Daily Pivot Point S2 | 23.76 |
| Daily Pivot Point S3 | 23.55 |
| Daily Pivot Point R1 | 24.21 |
| Daily Pivot Point R2 | 24.42 |
| Daily Pivot Point R3 | 24.54 |