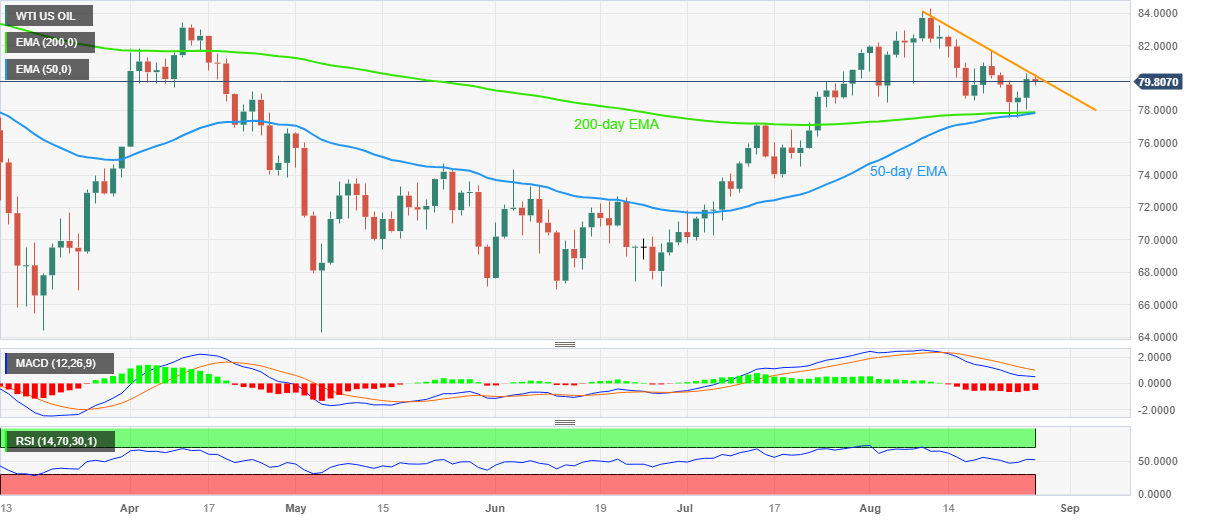
- WTI crude oil prints the first daily loss in three while retreating from short-term key resistance line.
- Convergence of 200-day EMA, 50-day EMA puts a floor under the Oil Price.
- Market’s cautious optimism also favors energy buyers despite mild losses.
WTI crude oil remains mildly offered near $79.80 as it takes a U-turn from a two-week-old resistance line to print the first daily loss in three heading into Monday’s European session. In doing so, the Black Gold also justifies the bearish MACD signals while struggling to cheer the softer US Dollar, as well as China-inspired risk-on mood.
That said, a downward-sloping resistance line from August 09, around $80.15 by the press time, restricts the immediate upside of the energy benchmark.
Given the downbeat MACD signals and the latest retreat from the key resistance line, the Oil price may witness further pullback in the price.
However, a convergence of the 200-day and 50-day Exponential Moving Averages (EMA), around $77.80 at the latest, appears a tough nut to crack for the Oil bears.
Also acting as a short-term downside filter is the early July peak of around $77.15, a break of which will quickly drag the WTI crude oil price towards the high marked in May around d $74.70.
On the flip side, a daily closing beyond the stated resistance line, close to $80.15 will aim for the previous weekly high of around $81.70 before April’s top of $83.40.
In a case where the black gold remains firmer past $83.40, the current monthly high of around $84.35 will act as the last defense of the WTI sellers.
WTI Price: Daily chart

Trend: Limited downside expected
ADDITIONAL IMPORTANT LEVELS
| OVERVIEW |
|---|
| Today last price | 79.76 |
| Today Daily Change | -0.17 |
| Today Daily Change % | -0.21 |
| Today daily open | 79.93 |
| TRENDS |
|---|
| Daily SMA20 | 80.94 |
| Daily SMA50 | 76.58 |
| Daily SMA100 | 75.12 |
| Daily SMA200 | 75.96 |
| LEVELS |
|---|
| Previous Daily High | 80.3 |
| Previous Daily Low | 78.06 |
| Previous Weekly High | 81.68 |
| Previous Weekly Low | 77.53 |
| Previous Monthly High | 81.78 |
| Previous Monthly Low | 69.77 |
| Daily Fibonacci 38.2% | 79.45 |
| Daily Fibonacci 61.8% | 78.92 |
| Daily Pivot Point S1 | 78.56 |
| Daily Pivot Point S2 | 77.19 |
| Daily Pivot Point S3 | 76.32 |
| Daily Pivot Point R1 | 80.8 |
| Daily Pivot Point R2 | 81.67 |
| Daily Pivot Point R3 | 83.04 |