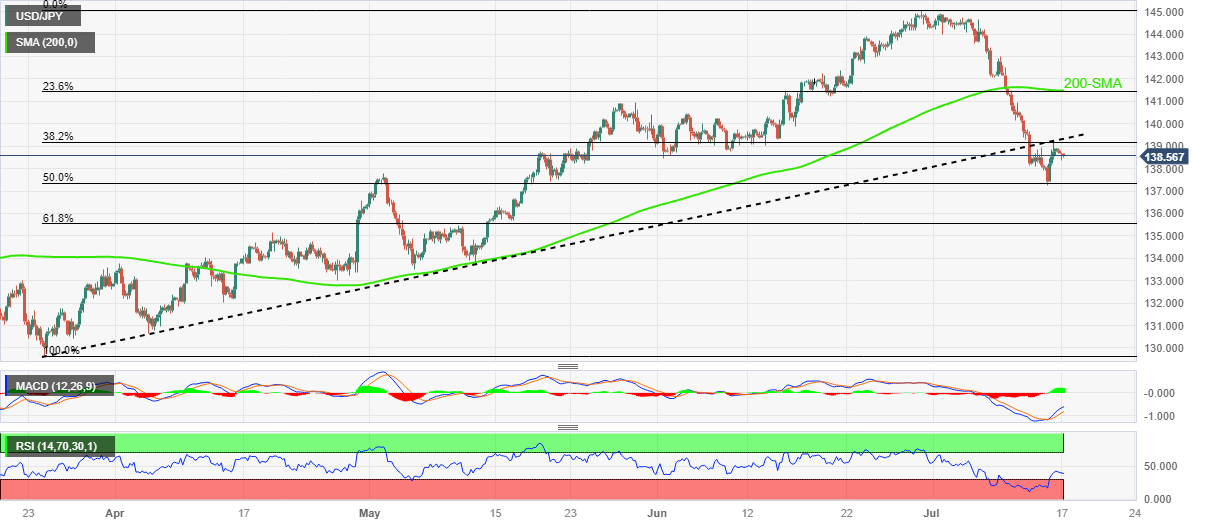
- USD/JPY fades the previous day’s corrective bounce off two-month low.
- Failure to cross previous support line, downbeat RSI (14) lure sellers.
- Bullish MACD signals suggest limited downside room; 141.50 appears a tough nut to crack for Yen pair buyers.
- Japan’s holiday, pre-Fed blackout restricts USD/JPY moves amid mixed sentiment.
USD/JPY clings to mild losses around 138.60 as market players seek fresh clues to extend the week-start retreat heading into Monday’s European session. In doing so, the Yen pair fades the previous day’s corrective bounce off the lowest levels since mid-May.
That said, the failure to extend late Friday’s corrective bounce off the multi-day low beyond the previous support line stretched from late March, now immediate resistance around 139.35, recall the USD/JPY sellers.
However, the 50% Fibonacci retracement level of the Yen pair’s up-moves from late March to June, near 137.40, could join the bullish MACD signals and the nearly oversold RSI (14) line to challenge the further downside.
It’s worth noting that early May’s peak of around 137.80 can act as an immediate support for the USD/JPY bears to watch whereas a sustained downside break of 137.40 will make the pair vulnerable to declining towards the 61.8% Fibonacci retracement level, surrounding 135.50.
Alternatively, a clear upside break of the support-turned-resistance line of around 139.35 isn’t an open invitation to the USD/JPY bulls as the 140.00 round figure could act as the additional upside filter.
Above all, the Yen pair remains on the bear’s radar unless witnessing a successful upside break of the convergence of 200-SMA and 23.6% Fibonacci retracement, near 141.50.
USD/JPY: Four-hour chart
Trend: Limited downside expected
ADDITIONAL IMPORTANT LEVELS
| OVERVIEW |
|---|
| Today last price | 138.58 |
| Today Daily Change | -0.23 |
| Today Daily Change % | -0.17% |
| Today daily open | 138.81 |
| TRENDS |
|---|
| Daily SMA20 | 142.52 |
| Daily SMA50 | 140.15 |
| Daily SMA100 | 137.02 |
| Daily SMA200 | 137.09 |
| LEVELS |
|---|
| Previous Daily High | 139.16 |
| Previous Daily Low | 137.24 |
| Previous Weekly High | 143 |
| Previous Weekly Low | 137.24 |
| Previous Monthly High | 145.07 |
| Previous Monthly Low | 138.43 |
| Daily Fibonacci 38.2% | 138.43 |
| Daily Fibonacci 61.8% | 137.97 |
| Daily Pivot Point S1 | 137.65 |
| Daily Pivot Point S2 | 136.49 |
| Daily Pivot Point S3 | 135.73 |
| Daily Pivot Point R1 | 139.57 |
| Daily Pivot Point R2 | 140.32 |
| Daily Pivot Point R3 | 141.49 |