- USD/CAD oscillates in a narrow trading band below the multi-month top set on Tuesday.
- Bullish Oil prices underpin the Loonie and cap the upside amid subdued USD price action.
- Traders now look forward to the BoC policy decision before placing fresh directional bets.
The USD/CAD pair lacks any firm intraday directional bias on Wednesday and seesaws between tepid gains/minor losses through the Asian session. Spot prices currently trade just below mid-1.3600s and remain well within the striking distance of the highest level since March 28 touched on Tuesday.
Crude Oil prices stand tall near the YTD peak and seem to underpin the commodity-linked Loonie. The US Dollar (USD), on the other hand, consolidates its recent strong gains to a nearly six-month top and remains well supported by growing acceptance that the Federal Reserve (Fed) will keep interest rates higher for longer. The aforementioned diverging forces fail to provide any meaningful impetus to the USD/CAD pair as investors now look to the Bank of Canada (BoC) policy decision for a fresh impetus.
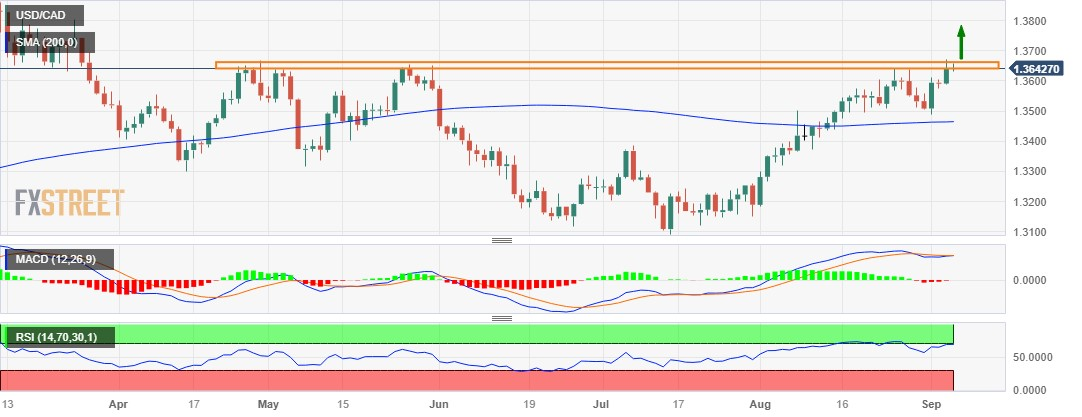
From a technical perspective, the overnight sustained strength beyond the 1.3600 mark was seen as a fresh trigger for bullish traders. The USD/CAD pair, however, struggles to find acceptance above the 1.3645-1.3650 horizontal barrier. This, along with the fact that the Relative Strength Index (RSI) on the daily chart has moved on the verge of breaking into the overbought territory, warrants some caution before positioning for any further appreciating move heading into the key central bank event risk.
In the meantime, any corrective slide now seems to find support near the 1.3600 round figure, below which the USD/CAD pair could decline towards the next relevant support near the 1.3525 region. Some follow-through selling could drag spot prices further below the 1.3500 psychological mark, towards testing the very important 200-day Simple Moving Average (SMA), currently around the 1.3460 area. The latter should act as a pivotal point, which if broken might shift the bias in favour of bearish traders.
On the flip side, the 1.3665-1.3670 area, or the overnight swing high, could act as an immediate resistance, which if cleared should allow the USD/CAD pair to reclaim the 1.3700 mark. The positive momentum could get extended further towards the 1.3730 resistance zone en route to the 1.3800 round figure and the YTD peak, around the 1.3860 region touched in March.
USD/CAD daily chart
Technical levels to watch
USD/CAD
| OVERVIEW |
|---|
| Today last price | 1.3644 |
| Today Daily Change | 0.0002 |
| Today Daily Change % | 0.01 |
| Today daily open | 1.3642 |
| TRENDS |
|---|
| Daily SMA20 | 1.3536 |
| Daily SMA50 | 1.3364 |
| Daily SMA100 | 1.34 |
| Daily SMA200 | 1.3464 |
| LEVELS |
|---|
| Previous Daily High | 1.367 |
| Previous Daily Low | 1.3589 |
| Previous Weekly High | 1.3637 |
| Previous Weekly Low | 1.3489 |
| Previous Monthly High | 1.364 |
| Previous Monthly Low | 1.3184 |
| Daily Fibonacci 38.2% | 1.3639 |
| Daily Fibonacci 61.8% | 1.362 |
| Daily Pivot Point S1 | 1.3597 |
| Daily Pivot Point S2 | 1.3553 |
| Daily Pivot Point S3 | 1.3516 |
| Daily Pivot Point R1 | 1.3678 |
| Daily Pivot Point R2 | 1.3714 |
| Daily Pivot Point R3 | 1.3758 |