Wall Street was anticipating today’s reports from Amazon (AMZN.US) and Apple (AAPL.US) – the two companies have a combined total of about $4.5 trillion and a sizable weighting in the major stock indexes. Amazon’s results significantly beat analysts’ forecasts in terms of both revenue and earnings. In contrast, Apple’s highly anticipated report-although it beat forecasts-failed to surprise the market by a similar magnitude to Amazon, with the company’s shares losing ground in trading after Wall Street closed. In addition, sales of the company’s flagship iPhones fell more than 2% year-on-year. It is worth noting that Apple’s capitalization is nearly double that of Amazon. Index contracts have thus erased a good portion of the earlier gains. What do we see in the results of both companies?
Amazon (AMZN.US) results – shares gain 8% in premarket
- Revenues: $134.38 billion vs. $131.63 billion forecast and $121.1 billion in Q2 2022 (11% y/y growth)
- Earnings per share: $0.65 vs. $0.35 forecasts ($6.7 billion in net income)
- Operating margin: 5.7% vs. 3.46% forecasts
- Operating profit: $7.68 billion vs. $4.72 billion forecasts
- E-Commerce revenue: $52.97 billion vs. $52.45 billion forecasts (4% y/y growth)
- Amazon Web Services (AWS) revenue: $22.14 billion vs. $21.71 billion forecasts (12% y/y growth)
- Advertising revenue: $10.7 billion (22% y/y growth)
- Point-of-sale (Whole Foods, AmazonGo): $5.02 billion vs. $4.96 billion forecast (6% y/y growth)
- Revenue from third-party suppliers: $32.3 billion (18% y/y growth)
- Revenues in North America: $82.55 billion vs. $79.68 billion forecasts
- Subscription revenue (Amazon Prime): $9.89 billion vs. $9.79 billion forecasts (14% y/y growth)
- Shipping service expenses: $20.4 billion (6% y/y growth)
Amazon raised Q3 revenue forecasts – sees them in the range of $138 billion to $143 billion vs. estimates of $138.3 billion (9 to 13% y/y growth). The company estimates operating profit in the range of $5.5 billion to $8 billion, so at least double the $2.5 billion in Q2 2022.
- The strong results are largely due to a strong US consumer, and it seems that as long as macro data does not show a slowdown in North America – sentiment around Amazon will remain at least at decent levels;
- Wall Street expected the strongest report since 2021, Amazon more than met those expectations. Shareholders should be particularly pleased by the improvement in margins, which for months had been cited as the ‘Achilles’ heel’ of the company’s business model.
- AWS’s profit rose double-figure year-over-year but still below the 33% y/y growth it achieved in Q2 2022. However, it is worth considering the size of AWS – as it increases its share of the cloud computing market, it becomes obvious that growth of more than 30% y/y is virtually impossible. The fact is, therefore, that AWS business growth is slowing down a bit (but still growing);
- The company intends to integrate more AI into services and produts. Higher shipping costs were related to optimization of services with a focus on Amazon’s user experience and satisfaction.
Apple (APPL.US) results – shares lose 2% in premarket
- Revenue: $81.8 billion vs. $81.55 billion forecasts
- Earnings per share: $1.26 vs $1.20 forecasts
- iPhone revenue:$39.67 billion vs $39.8 billion forecasts (2.4% y/y decline)
- Products revenue: $60.58 billion vs $60.67 billion forecasts
- Services revenue: $21.21 billion vs $20.77 billion forecasts (8.2% increase y/y)
- Operating expenses: $13.42 billion vs $13.5 billion forecasts
- MacBook revenue: $6.84 billion vs $6.37 billion forecasts (7.3% y/y decrease)
- Ipad revenue: $5.79 billion vs. $6.33 billion forecasts (19.8% y/y decline)
- Revenue in China: $15.76 billion vs. $14.59 billion forecasts
- Wearables revenue: $8.28 billion vs $8.38 billion (2.5% y/y increase)
- Gross margin: 44.5% vs 44.2% forecasts
- Free cash flow: $26 billion vs. $22.94 billion forecasts
- Cash: $166.5 billion vs. $179 billion in Q2 2023
The report’s weak point was primarily lower-than-forecast iPhone sales, suggesting a weaker consumer and a slowdown in the smartphone industry. However, ynks were expecting this, as well as a slowdown in MacBook sales, which reflect a weaker PC market.Lower-than-forecast revenue from smart home devices may reflect greater consumer restraint but still increased y/y. CFO Maestri indicated that the current quarter is expected to be slightly better than the current quarter (seasonally Q2 for Apple is usually the weakest). Sentiment around Apple’s stock, however, has been high enough in recent months that a ‘good report’ is not enough to encourage the market to buy the stock at even higher prices.
Sales of Apple’s flagship devices slowed y/y but strong services (light blue line) should please. Source: Zerohedge
- Apple will unveil a new iPhone15 model in September and is also expected to unveil new VR products – VisionPro in early 2024. The company’s strong overall health may ultimately be taken by the market as a good proxy for Q3 and Q4, which are seasonally the strongest for the company with Q2 being the weakest on that side.
- The question investors are likely to ask in the next few months will be whether the unveiling of a new iPhone model or VR products, which the company has priced at around $3,500, will result in equally strong buyer interest in a higher interest rate environment;
- Strong components of the report include higher sales in China and, despite lower product sales, record revenues from services, which have the highest net margins (ApplePay, AppleMusic, etc.).
- Lower costs despite costly diversification of manufacturing locations and a significant positive surprise in free cash flow underscore the company’s still very strong business model. Tim Cook, Apple’s CEO, indicated that the company has been developing and exploring the possibilities of generative AI for years and will continue to increase spending as well as AI implementation to improve products and user experience.
Charts
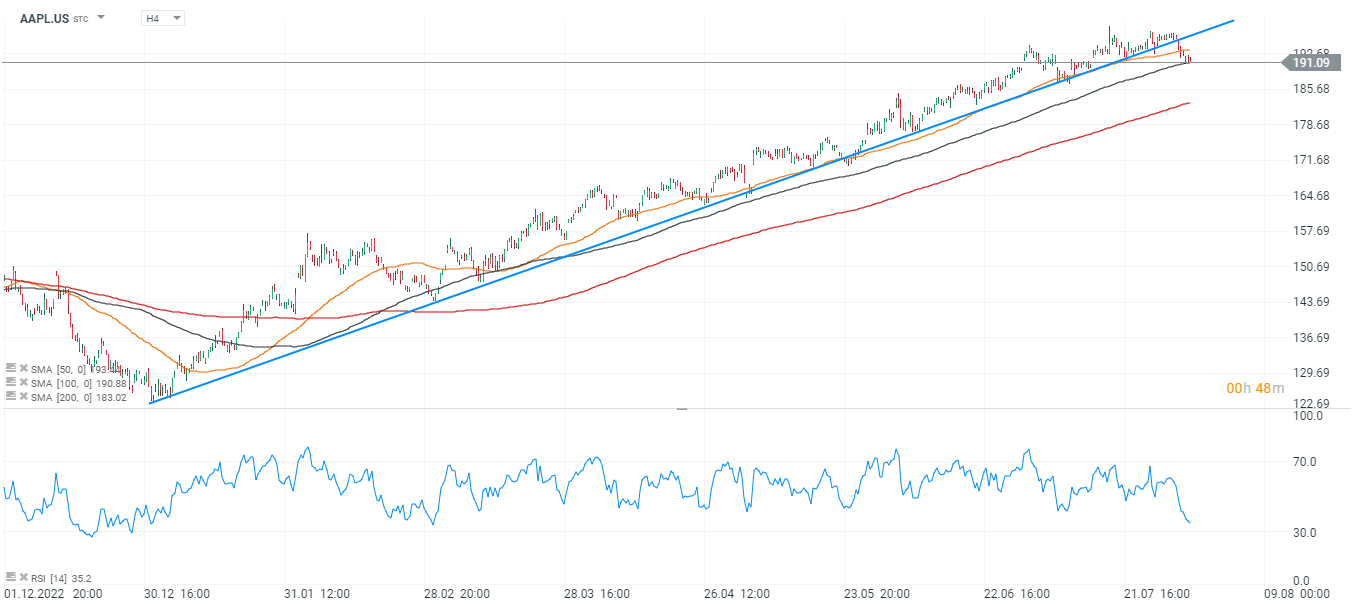 Apple (AAPL.US) shares may be headed for a test of the SMA200 at $183 per share, an upward trend line has been broken. Source: xStation5
Amazon (AMZN.US) shares are trading higher, and if demand continues they could eventually aim to test the area around $145 – the level of the local peak in August 2022 – since then the company’s performance has improved significantly. Source: xStation5