- Silver regains positive traction on Thursday and climbs closer to trend-channel resistance.
- The mixed technical indicators on hourly/daily charts warrant caution for bullish traders.
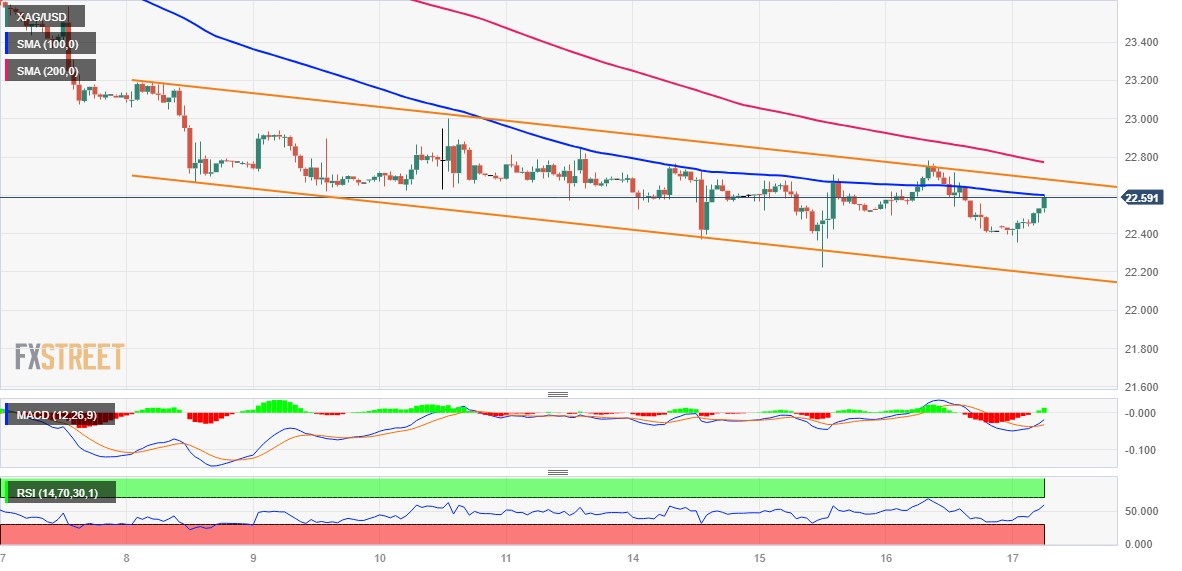
- A move beyond the 200-hour SMA is needed to support prospects for any further gains.
Silver attracts fresh buying near the $22.35 region on Thursday and sticks to its modest intraday gains through the early part of the European session. The white metal currently trades around the $22.60-$22.65 area, up just over 1.0% for the day, though remains well within the striking distance of a nearly two-month low touched on Tuesday.
Looking at a slightly broader picture, the XAG/USD has been drifting lower along a downward-sloping channel over the past one-and-half-week or so. The top end of the said channel, currently pegged around the $22.70 region, might continue to cap any subsequent move up beyond the 100-hour Simple Moving Average (SMA). This is followed by the 200-hour SMA, near the $22.75-$22.80 region, which if cleared decisively will set the stage for some meaningful appreciating move.
Technical indicators on the 4-hour chart, though have recovered from the bearish territory, are yet to confirm a positive bias and are still holding deep in the negative zone on the daily chart. This makes it prudent to wait for a sustained strength beyond the aforementioned barrier before confirming that the XAG/USD has formed a near-term bottom and placing fresh bets. The subsequent move up could lift the white metal beyond the $23.00 round figure, towards the $23.25 region.
The latter represents the very important 200-day SMA and should act as a pivotal point. A sustained strength beyond might trigger a fresh bout of a short-covering move and lift the XAG/USD to the $23.60-$23.65 horizontal barrier. The momentum could get extended further and allow bulls to aim to reclaim the $24.00 round figure.
On the flip side, the weekly low, around the $22.20 area, followed by the $22.10 zone, or the multi-month trough touched in June, which coincides with the trend-channel support, could protect the immediate downside ahead of the $22.00 mark. Some follow-through selling could accelerate the fall towards the $21.55-$21.50 area en route to the $21.00 round figure. The XAG/USD might then weaken the $20.60 support before dropping to the $20.00 psychological mark.
Silver 1-hour chart
Technical levels to watch
XAU/USD
| OVERVIEW |
|---|
| Today last price | 1897.42 |
| Today Daily Change | 5.66 |
| Today Daily Change % | 0.30 |
| Today daily open | 1891.76 |
| TRENDS |
|---|
| Daily SMA20 | 1937.62 |
| Daily SMA50 | 1938.09 |
| Daily SMA100 | 1964.32 |
| Daily SMA200 | 1905.12 |
| LEVELS |
|---|
| Previous Daily High | 1907.27 |
| Previous Daily Low | 1891.68 |
| Previous Weekly High | 1946.82 |
| Previous Weekly Low | 1910.92 |
| Previous Monthly High | 1987.54 |
| Previous Monthly Low | 1902.77 |
| Daily Fibonacci 38.2% | 1897.64 |
| Daily Fibonacci 61.8% | 1901.31 |
| Daily Pivot Point S1 | 1886.54 |
| Daily Pivot Point S2 | 1881.31 |
| Daily Pivot Point S3 | 1870.95 |
| Daily Pivot Point R1 | 1902.13 |
| Daily Pivot Point R2 | 1912.49 |
| Daily Pivot Point R3 | 1917.72 |