- Silver Price prints mild gains at two-week low after falling the most in a month.
- Oversold RSI (14) allows XAG/USD to prod five-day losing streak at multi-day bottom.
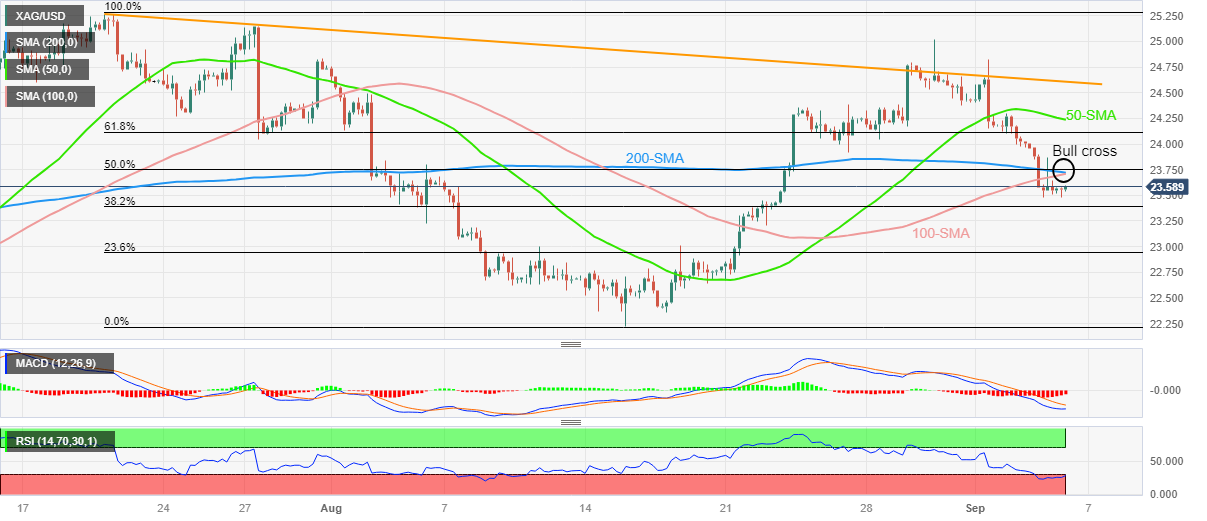
- Downbeat MACD signals, Bull Cross test Silver sellers amid sluggish markets.
- XAG/USD rebound remains elusive below $23.75, descending trend line from late July is a tough nut to crack for buyers.
Silver Price (XAG/USD) licks its wounds while posting mild gains near $23.55 heading into Wednesday’s European session. In doing so, the bright metal bounces off the lowest level in two weeks, marked the previous day, as it consolidates the biggest daily loss in a month.
That said, the oversold RSI conditions seem to help the risk takers while the XAG/USD prints the first daily gain in six, so far.
However, the bearish MACD signals and an impending Bull Cross between the 100-SMA and the 200-SMA, a bullish signal for the asset’s price when the short-term SMA pierces the longer-term ones from below, test the Silver bears of late.
In a case where the Silver buyers manage to confirm the bull cross by surpassing the SMA confluence surrounding $23.75, a quick run-up towards the 61.8% Fibonacci retracement of July–August downside, near $24.15, and then to the 50-SMA level of $24.25 can’t be denied.
Even so, a downward-sloping resistance line from July 20, close to $24.65 at the latest, appears a tough nut to crack for the Silver buyers past $24.25.
On the contrary, the 38.2% and 23.6% Fibonacci ratios, respectively near $23.40 and $22.95, will challenge the Silver bears before directing them to the previous monthly low of around $22.25.
Silver Price: Four-hour chart
Trend: Further Downside expected
ADDITIONAL IMPORTANT LEVELS
| OVERVIEW |
|---|
| Today last price | 23.56 |
| Today Daily Change | 0.02 |
| Today Daily Change % | 0.08% |
| Today daily open | 23.54 |
| TRENDS |
|---|
| Daily SMA20 | 23.51 |
| Daily SMA50 | 23.72 |
| Daily SMA100 | 23.91 |
| Daily SMA200 | 23.46 |
| LEVELS |
|---|
| Previous Daily High | 24 |
| Previous Daily Low | 23.48 |
| Previous Weekly High | 25.02 |
| Previous Weekly Low | 24.05 |
| Previous Monthly High | 25.02 |
| Previous Monthly Low | 22.23 |
| Daily Fibonacci 38.2% | 23.68 |
| Daily Fibonacci 61.8% | 23.8 |
| Daily Pivot Point S1 | 23.34 |
| Daily Pivot Point S2 | 23.14 |
| Daily Pivot Point S3 | 22.81 |
| Daily Pivot Point R1 | 23.87 |
| Daily Pivot Point R2 | 24.2 |
| Daily Pivot Point R3 | 24.4 |