- Silver attracts some sellers following an intraday uptick to the $23.00 neighbourhood.
- The mixed technical setup warrants some caution before placing fresh directional bets.
- A move beyond the $22.30-40 confluence will set the stage for some meaningful gains.
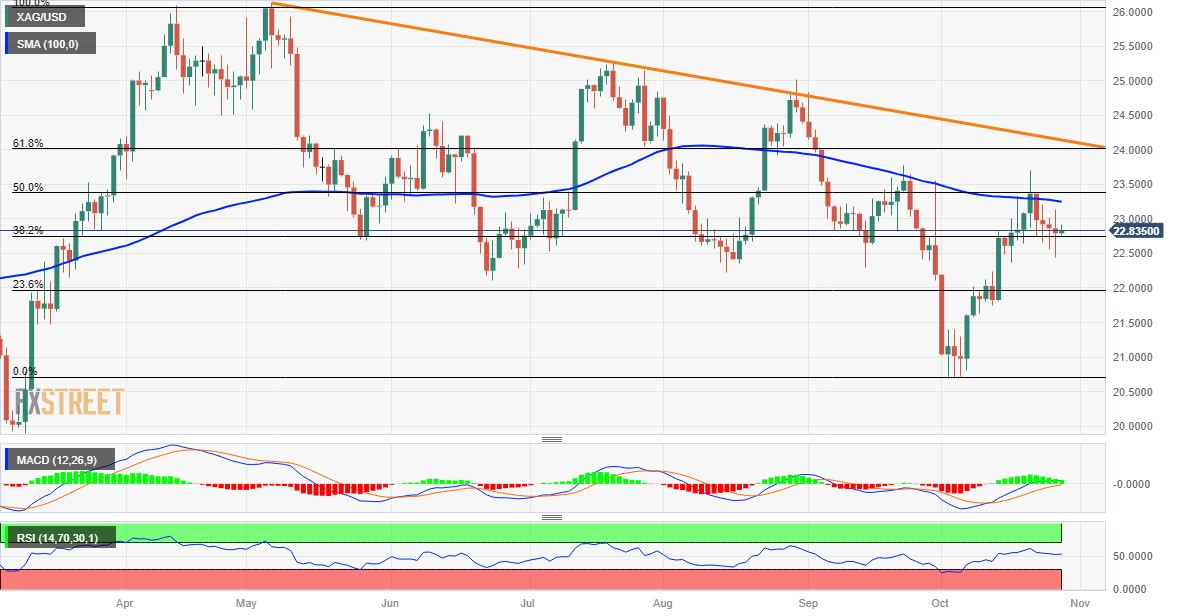
Silver (XAG/USD) struggles to capitalize on its modest intraday uptick and attracts some intraday sellers in the vicinity of the $23.00 mark on Friday. The white metal currently trades around the $22.80 region, nearly unchanged for the day, and remains confined in a multi-day-old range through the first half of the European session.
From a technical perspective, the XAG/USD has been showing some resilience below the 38.2% Fibonacci retracement level of the May-October slide. Moreover, oscillators on the daily chart are holding in the positive territory and support prospects for some appreciating move. That said, the recent failure near the $23.70-$23.75 strong horizontal resistance and the lack of any buying interest warrants some caution for bullish traders.
Hence, it will be prudent to wait for sustained strength and acceptance above the $23.30-$23.40 confluence, comprising the 50% Fibo. level, the 100-day and 200-day Simple Moving Averages (SMAs), before positioning for a meaningful upside. Some follow-through buying beyond the $23.70-$23.75 region will reaffirm the positive bias and allow the XAG/SUD to reclaim the $24.00 mark, which coincides with the 61.8% Fibo. level.
The subsequent move up, meanwhile, is more likely to confront stiff resistance near a descending trend-line hurdle extending from the May high, currently pegged around the $24.20 region. A convincing breakout through the latter will be seen as a fresh trigger for bulls and pave the way for additional gains.
On the flip side, the $22.50 area, nearing a one-and-half-week low touched on Thursday, now seems to protect the immediate downside for the XAG/USD. Failure to defend the said support levels might prompt some technical selling and expose the $22.30-$22.25 horizontal resistance breakpoint now turned support. The downward trajectory could get extended further towards the $22.00 round-figure mark, representing 23.6% Fibo. level.
Silver daily chart
Technical levels to watch
XAG/USD
| OVERVIEW |
|---|
| Today last price | 22.79 |
| Today Daily Change | 0.00 |
| Today Daily Change % | 0.00 |
| Today daily open | 22.79 |
| TRENDS |
|---|
| Daily SMA20 | 22.23 |
| Daily SMA50 | 22.96 |
| Daily SMA100 | 23.26 |
| Daily SMA200 | 23.3 |
| LEVELS |
|---|
| Previous Daily High | 23.14 |
| Previous Daily Low | 22.44 |
| Previous Weekly High | 23.7 |
| Previous Weekly Low | 22.37 |
| Previous Monthly High | 24.82 |
| Previous Monthly Low | 22.12 |
| Daily Fibonacci 38.2% | 22.71 |
| Daily Fibonacci 61.8% | 22.88 |
| Daily Pivot Point S1 | 22.44 |
| Daily Pivot Point S2 | 22.1 |
| Daily Pivot Point S3 | 21.75 |
| Daily Pivot Point R1 | 23.14 |
| Daily Pivot Point R2 | 23.49 |
| Daily Pivot Point R3 | 23.84 |