- Gold Price pares the biggest weekly gain since April amid mixed sentiment, Fed blackout.
- China headlines, data joins Friday’s US statistics to underpin XAU/USD pullback amid pre-FOMC silence.
- Risk catalysts, US/China clues eyed as Gold Price stays beyond key support confluence.
Gold Price (XAU/USD) remains on the back foot for the second consecutive day, extending the previous day’s pullback from the highest level in a month, as the US Dollar consolidates recent losses amid a sluggish start of the week.
While tracing the main catalysts behind the US Dollar Index (DXY) rebound, after posting the biggest weekly loss since November, Friday’s upbeat US inflation data and fears surrounding China gain major attention. Also exerting downside pressure on the Gold Price is the market’s preparations for July’s Federal Open Market Committee (FOMC) monetary policy meeting, expected to unveil a 0.25% increase in the benchmark interest rates. It should be noted that a two-week silence period for the Fed officials ahead of the FOMC also allows the US Dollar to lick its wounds and weigh on the Gold Price of late. Furthermore, comments suggesting inflation fears from the International Monetary Fund (IMF) also weigh on the XAU/USD price despite the lackluster session and the US Dollar’s inability to remain firmer.
Moving on, a light calendar challenges XAU/USD traders, especially amid the pre-Fed silence of the policymakers. Even so, Monday’s NY Empire State Manufacturing Index for June and Wednesday’s US Retail Sales for the said month will be important to watch for clear directions. Above all, risk catalysts will be crucial for the near-term direction of the Gold Price.
Gold Price: Key levels to watch
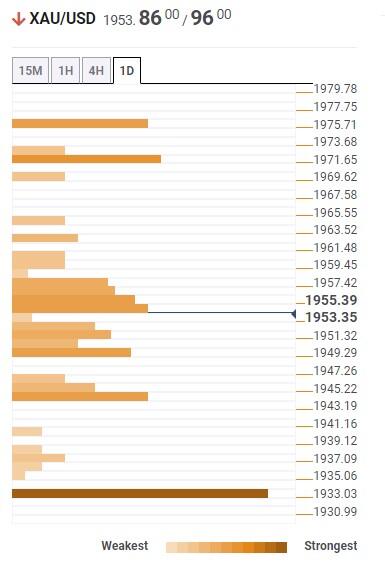
As per our Technical Confluence Indicator, the Gold Price remains well beyond the key support confluence comprising the 10-day SMA and Fibonacci 61.8% on one-week, around $1,935 by the press time.
That said, the Pivot Point one-day S2 and Fibonacci 38.2% on one-week highlights $1,945 as immediate support for the Gold sellers to watch during the quote’s further downside.
It’s worth noting that the XAU/USD weakness past $1,935 makes it vulnerable to decline towards the $1,900 round figure. However, the monthly low of near $1,893 could challenge the Gold bears afterward.
Meanwhile, 50-day SMA joins Fibonacci 38.2% on one-day to suggest $1,960 as nearby resistance for the Gold Price.
Following that, the upper band of the Bollinger on the four-hour chart, Pivot Point one-month R1 and Fibonacci 161.8% on one-day, near $1,972, could challenge the XAU/USD run-up.
In a case where the Gold buyers keep the reins past $1,972, a convergence of the Pivot Point one-week R1 and Pivot Point one-day R3, around $1,978, appears the last defense of the XAU/USD sellers before fueling the quote toward the $2,000 psychological magnet.
Here is how it looks on the tool
About Technical Confluences Detector
The TCD (Technical Confluences Detector) is a tool to locate and point out those price levels where there is a congestion of indicators, moving averages, Fibonacci levels, Pivot Points, etc. If you are a short-term trader, you will find entry points for counter-trend strategies and hunt a few points at a time. If you are a medium-to-long-term trader, this tool will allow you to know in advance the price levels where a medium-to-long-term trend may stop and rest, where to unwind positions, or where to increase your position size.