- EUR/USD struggles to retrace the recent losses amid market caution ahead of Fed decision.
- MACD indicates a positive signal for potential price appreciation.
- The 1.0650 psychological level emerges as the key support, followed by the previous week’s low.
EUR/USD attempts to recover from the previous day’s losses, hovering around 1.0680 during the Asian session on Wednesday. The pair remains sideways due to the market caution ahead of the interest rate decision by the US Federal Reserve (Fed), scheduled for release later in the North American session.
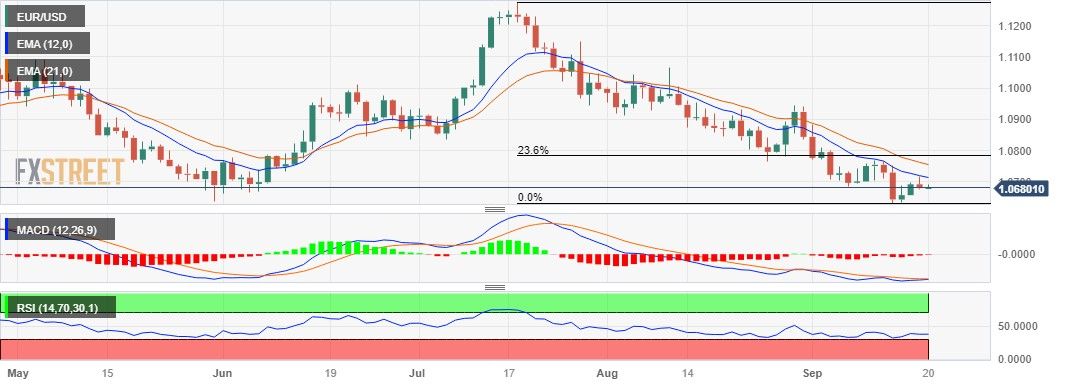
The key support for the EUR/USD pair appears around the 1.0650 psychological level, followed by the previous week’s low at 1.0631.
If bearish sentiment continues to exert pressure, there is a possibility that the currency pair could approach the next support level around the significant psychological level of 1.0600.
On the upside, the EUR/USD pair could face a barrier around the 1.0700 psychological level, followed by the 12-day Exponential Moving Average (EMA) at 1.0713.
A firm break above the latter could open the doors for the pair to explore the region around the 21-day EMA at 1.0754 aligned to the 23.6% Fibonacci retracement at 1.0783 level.
The Moving Average Convergence Divergence (MACD) line remains below the centerline but lies above the signal line. This configuration indicates that the shorter-term moving average is trending higher than the longer-term moving average, which is a positive signal for potential price appreciation.
However, the selling pressure in the EUR/USD pair prevails as the 14-day Relative Strength Index (RSI) lies below the 50 level.
EUR/USD: Daily Chart
EUR/USD: ADDITIONAL IMPORTANT LEVELS
| OVERVIEW |
|---|
| Today last price | 1.0682 |
| Today Daily Change | 0.0002 |
| Today Daily Change % | 0.02 |
| Today daily open | 1.068 |
| TRENDS |
|---|
| Daily SMA20 | 1.0763 |
| Daily SMA50 | 1.0918 |
| Daily SMA100 | 1.0889 |
| Daily SMA200 | 1.0829 |
| LEVELS |
|---|
| Previous Daily High | 1.0718 |
| Previous Daily Low | 1.0675 |
| Previous Weekly High | 1.0769 |
| Previous Weekly Low | 1.0632 |
| Previous Monthly High | 1.1065 |
| Previous Monthly Low | 1.0766 |
| Daily Fibonacci 38.2% | 1.0691 |
| Daily Fibonacci 61.8% | 1.0702 |
| Daily Pivot Point S1 | 1.0664 |
| Daily Pivot Point S2 | 1.0648 |
| Daily Pivot Point S3 | 1.0621 |
| Daily Pivot Point R1 | 1.0707 |
| Daily Pivot Point R2 | 1.0734 |
| Daily Pivot Point R3 | 1.075 |