- EUR/JPY gains traction around 147.40 amid the Euro demand.
- The cross holds below the 50- and 100-hour EMAs; the Relative Strength Index (RSI) stands above 50, within bullish territory.
- The immediate resistance level is located at 157.50; the initial support level is seen at 156.63.
The EUR/JPY pair gains momentum near 157.40 during the early European session on Friday. Market players await the second-tier economic data release from the Eurozone ahead of the European Central Bank (ECB)’s President Christine Lagarde speech.
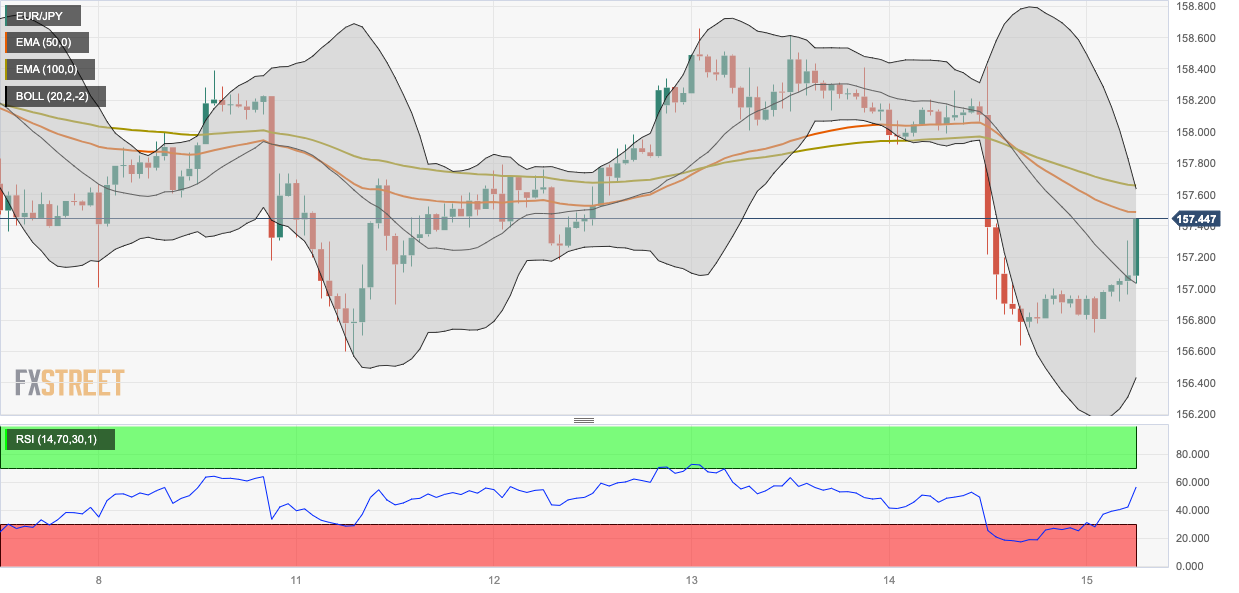
According to the one-hour chart, EUR/JPY holds below the 50- and 100-hour Exponential Moving Averages (EMAs), which means further downside looks favorable. However, the Relative Strength Index (RSI) stands above 50, within bullish territory, suggesting that buyers will likely retain control soon.
Therefore, the cross could meet the immediate resistance level near the 50-hour EMA at 157.50. The key barrier is located at 157.65, representing the 100-hour EMA and the upper boundary of the Bollinger Band. The additional upside filter to watch is 158.00 (a psychological round mark and a low of September 13), followed by 158.52 (a high of September 7).
On the downside, the cross will see an initial support level at 156.63 (a low of September 14). Any follow-through selling will see a drop to the lower limit of the Bollinger Band at 156.45. Further south, the cross will see the next contention level at 156.00, highlighting a psychological round figure and a low of August 7. Finally, the downside stop to watch at 155.85 (a low of August 3).
EUR/JPY one-hour chart
EUR/JPY
| OVERVIEW |
|---|
| Today last price | 157.42 |
| Today Daily Change | 0.46 |
| Today Daily Change % | 0.29 |
| Today daily open | 156.96 |
| TRENDS |
|---|
| Daily SMA20 | 158.13 |
| Daily SMA50 | 157.18 |
| Daily SMA100 | 154.42 |
| Daily SMA200 | 148.68 |
| LEVELS |
|---|
| Previous Daily High | 158.42 |
| Previous Daily Low | 156.64 |
| Previous Weekly High | 158.52 |
| Previous Weekly Low | 157 |
| Previous Monthly High | 159.76 |
| Previous Monthly Low | 155.53 |
| Daily Fibonacci 38.2% | 157.32 |
| Daily Fibonacci 61.8% | 157.74 |
| Daily Pivot Point S1 | 156.26 |
| Daily Pivot Point S2 | 155.56 |
| Daily Pivot Point S3 | 154.48 |
| Daily Pivot Point R1 | 158.04 |
| Daily Pivot Point R2 | 159.12 |
| Daily Pivot Point R3 | 159.82 |