- AUD/USD pares intraday gains within two-week-old symmetrical triangle.
- Upbeat RSI, clear break of previous resistance line from late July keep Aussie buyers hopeful.
- RBA’s Bullock needs to defend hawkish bias, US data should ease to defend pair bulls.
- Sellers remain hopeful below 0.6630 but downside room appears limited until 0.6360.
AUD/USD retreats from intraday high to 0.6445 as markets brace for key Aussie catalysts heading into Tuesday’s European session. Even so, the risk-barometer pair remains firmer for the second consecutive day while staying inside a fortnight-old symmetrical triangle.
That said, Reserve Bank of Australia (RBA) Deputy Governor Michele Bullock, to be the Governor in three weeks, is up for a speech and will be closely observed as the pair buyers run out of steam due to fears of policy pivot. Following that, the US Conference Board’s (CB) Consumer Confidence Index for August, expected at 116.2 versus prior 117.00, will direct the AUD/USD pair’s moves.
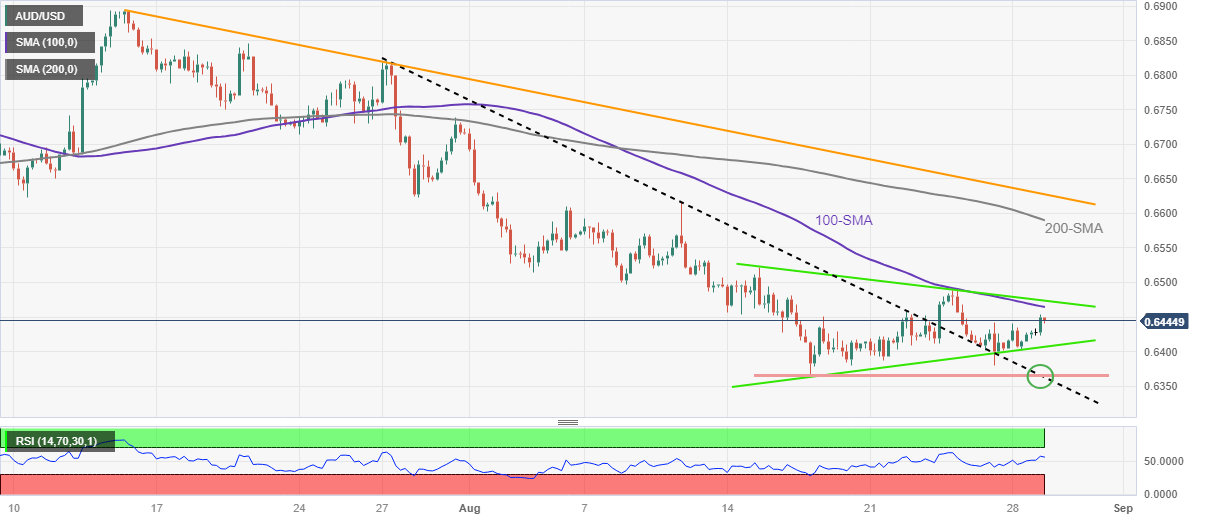
Technically, the Aussie pair remains on the front foot despite the latest inaction as it defends the previous week’s upside break of a one-month-old resistance line, now support around 0.6360, with a symmetrical triangle. Adding strength to the upside bias is the firmer RSI (14) line, not overbought.
However, the 100-SMA and the stated triangle’s top line, respectively near 0.6465 and 0.6475, could restrict the pair’s immediate upside ahead of the 200-SMA hurdle of 0.6590.
In a case where the AUD/USD remains firmer past 0.6590, a downward-sloping resistance line from July 14, close to 0.6630 at the latest, will be in the spotlight.
On the contrary, a downside break of the stated triangle’s bottom line, close to the 0.6400 threshold as we write, isn’t an open invitation to the AUD/USD bears as a convergence of the previous resistance line and the yearly low, around 0.6360, appears a tough nut to crack for sellers.
AUD/USD: Four-hour chart
Limited upside expected
ADDITIONAL IMPORTANT LEVELS
| OVERVIEW |
|---|
| Today last price | 0.6444 |
| Today Daily Change | 0.0015 |
| Today Daily Change % | 0.23% |
| Today daily open | 0.6429 |
| TRENDS |
|---|
| Daily SMA20 | 0.6484 |
| Daily SMA50 | 0.6628 |
| Daily SMA100 | 0.6652 |
| Daily SMA200 | 0.6726 |
| LEVELS |
|---|
| Previous Daily High | 0.644 |
| Previous Daily Low | 0.6402 |
| Previous Weekly High | 0.6488 |
| Previous Weekly Low | 0.638 |
| Previous Monthly High | 0.6895 |
| Previous Monthly Low | 0.6599 |
| Daily Fibonacci 38.2% | 0.6425 |
| Daily Fibonacci 61.8% | 0.6416 |
| Daily Pivot Point S1 | 0.6407 |
| Daily Pivot Point S2 | 0.6386 |
| Daily Pivot Point S3 | 0.6369 |
| Daily Pivot Point R1 | 0.6445 |
| Daily Pivot Point R2 | 0.6462 |
| Daily Pivot Point R3 | 0.6483 |