- USD/JPY eases from seven-month high but bears appear lacking strength to retake control.
- Multiple supports toward the south, upbeat oscillators keep Yen pair buyers hopeful.
- Late 2022 peak provides headwind to immediate upside.
USD/JPY holds lower ground near the intraday bottom of around 141.50 as it prints the first daily loss in three while easing from the Year-To-Date (YTD) top heading into Monday’s European session.
In doing so, the Yen pair justifies the RSI (14) line’s retreat from the overbought territory.
However, a three-week-old previous resistance line joins bullish MACD signals to challenge the intraday sellers of the USD/JPY pair around 141.40.
Following that, an ascending trend line from the last Wednesday and the 100-Exponential Moving Average (EMA), respectively near 141.20 and 139.70, can restrict the quote’s further downside. It’s worth noting that the 140.00 round figure acts as an extra downside filter for the short term.
Even if the Yen pair drops below 139.70 support, early May’s high of near 137.75 and an ascending trend line from April 26, close to 136.50 at the latest, can act as the last defense of the bulls.
On the contrary, the 142.00 round figure guards the immediate upside of the USD/JPY pair ahead of the November 2022 high of around 142.20-25.
In a case where the Yen pair remains firmer past 142.25, the odds of witnessing a run-up towards a late October 2022 low of 145.10 can’t be ruled out.
USD/JPY: Four-hour chart
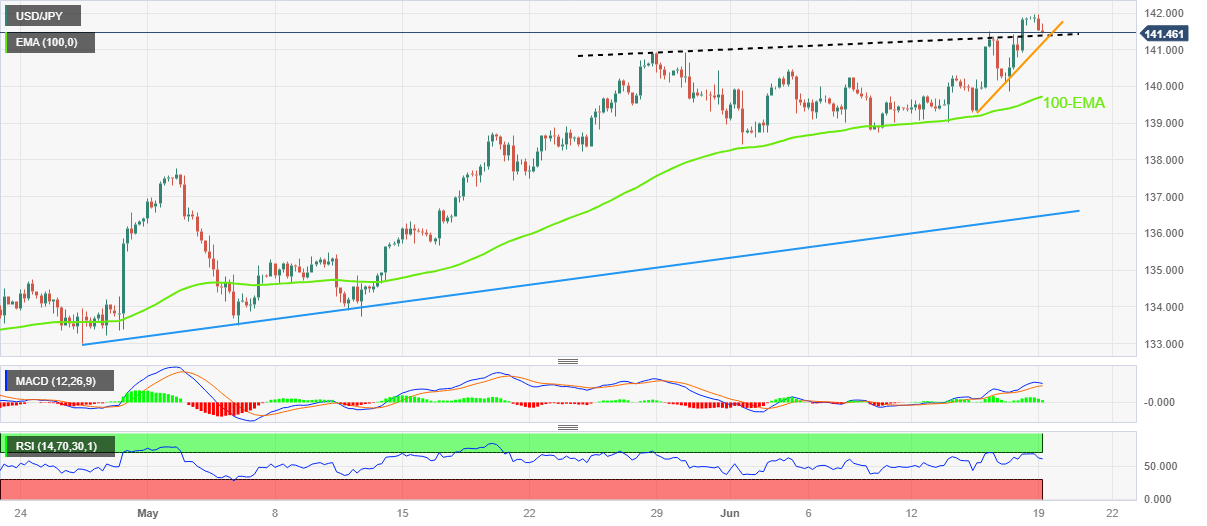
Trend: Bullish
ADDITIONAL IMPORTANT LEVELS
| OVERVIEW |
|---|
| Today last price | 141.54 |
| Today Daily Change | -0.32 |
| Today Daily Change % | -0.23% |
| Today daily open | 141.86 |
| TRENDS |
|---|
| Daily SMA20 | 139.77 |
| Daily SMA50 | 136.91 |
| Daily SMA100 | 135.01 |
| Daily SMA200 | 137.24 |
| LEVELS |
|---|
| Previous Daily High | 141.92 |
| Previous Daily Low | 139.85 |
| Previous Weekly High | 141.92 |
| Previous Weekly Low | 139.01 |
| Previous Monthly High | 140.93 |
| Previous Monthly Low | 133.5 |
| Daily Fibonacci 38.2% | 141.13 |
| Daily Fibonacci 61.8% | 140.64 |
| Daily Pivot Point S1 | 140.51 |
| Daily Pivot Point S2 | 139.15 |
| Daily Pivot Point S3 | 138.44 |
| Daily Pivot Point R1 | 142.57 |
| Daily Pivot Point R2 | 143.27 |
| Daily Pivot Point R3 | 144.63 |