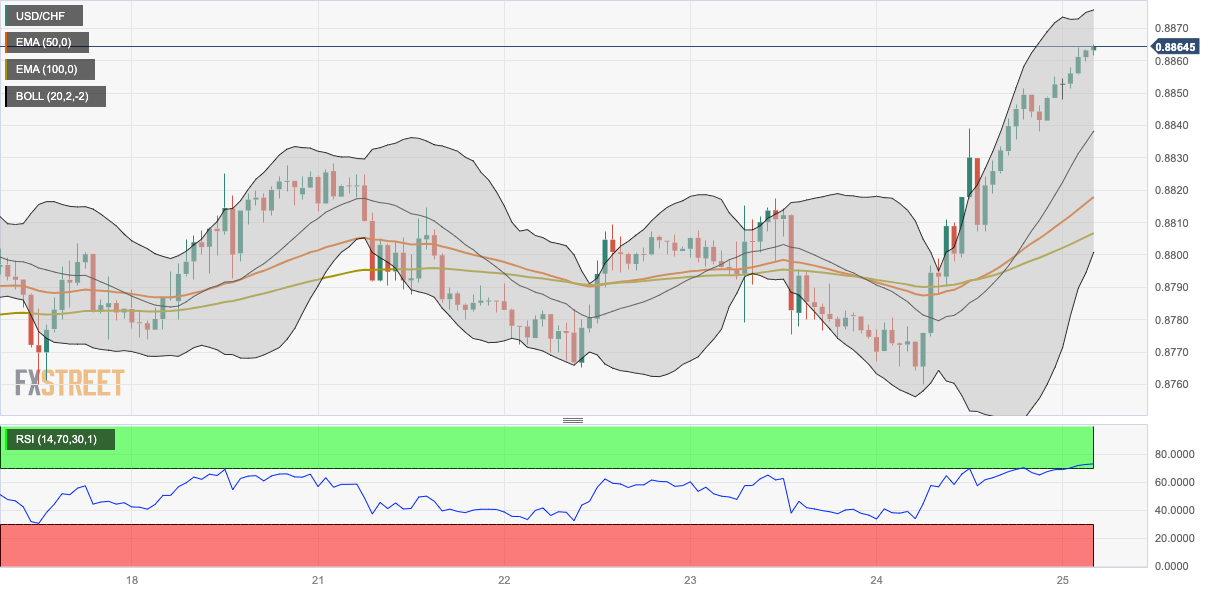
- USD/CHF gains momentum for two straight days above the 0.8850 mark on Friday.
- The pair holds above the 50- and 100-hour Exponential Moving Averages (EMAs) with an upward slope.
- The immediate resistance level will emerge at 0.8875; 0.8838, acts as an initial support level for the pair.
The USD/CHF pair extends its upside for the second consecutive day above the mid-0.8800s during the Asian session on Friday. Meanwhile, the US Dollar Index (DXY) surges above the 104.20 mark supported by the higher US Treasury yields and risk-off mood in the market ahead of the key event.
Philadelphia Federal Reserve (Fed) President Patrick Harker stated at the Jackson Hole Symposium that the central bank has probably done enough with restrictive monetary policy. He also said that he believes the Fed will remain interest rate stable this year, but that next year would depend on the data. While, Boston Fed President Susan Collins said further rate rises are possible and that sending a strong signal regarding the timing of rate cuts is premature. Market participants await Friday’s speech from Fed Chairman Jerome Powell at the Jackson Hole Symposium for fresh impetus. Hawkish comments from the officials could boost the USD and act as a tailwind for the USD/CHF pair.
According to the one-hour chart, USD/CHF holds above the 50- and 100-hour Exponential Moving Averages (EMAs) with an upward slope, which means the path of least resistance for the pair is to the upside. The Relative Strength Index (RSI) holds in bullish territory above 50. However, the overbought condition indicates that further consolidation cannot be ruled out before positioning for any near-term USD/CHF appreciation.
That said, the immediate resistance level for USD/CHF will emerge at 0.8875, representing a confluence of the upper boundary of the Bollinger Band and a low of July 7. The additional upside filter is located at 0.8915 (high of October 10) en route to 0.8950 (low of July 6) and finally at 0.8970 (high of July 7).
On the flip side, the midline of the Bollinger Band at 0.8838, acts as an initial support level for the pair. Further south, the next stop of the USD/CHF pair is located at 0.8815 (the 50-hour EMA). The key contention level to watch is the 0.8800-0.8805 region, portraying a psychological round mark, 100-hour EMA, and the lower limit of the Bollinger Band. Any intraday pullback below the latter would expose the next downside stop at 0.8765 (low of August 22).
USD/CHF one-hour chart
USD/CHF
| OVERVIEW |
|---|
| Today last price | 0.8864 |
| Today Daily Change | 0.0020 |
| Today Daily Change % | 0.23 |
| Today daily open | 0.8844 |
| TRENDS |
|---|
| Daily SMA20 | 0.877 |
| Daily SMA50 | 0.8799 |
| Daily SMA100 | 0.8892 |
| Daily SMA200 | 0.9087 |
| LEVELS |
|---|
| Previous Daily High | 0.8852 |
| Previous Daily Low | 0.876 |
| Previous Weekly High | 0.8828 |
| Previous Weekly Low | 0.8738 |
| Previous Monthly High | 0.9005 |
| Previous Monthly Low | 0.8552 |
| Daily Fibonacci 38.2% | 0.8817 |
| Daily Fibonacci 61.8% | 0.8795 |
| Daily Pivot Point S1 | 0.8786 |
| Daily Pivot Point S2 | 0.8727 |
| Daily Pivot Point S3 | 0.8694 |
| Daily Pivot Point R1 | 0.8877 |
| Daily Pivot Point R2 | 0.891 |
| Daily Pivot Point R3 | 0.8969 |