- GBP/USD retreats from the highest levels since April 2022, snaps four-day uptrend.
- Confirmation of bearish chart pattern, downbeat MACD signals conditions suggest further declines of the Cable pair.
- Multiple key supports, hawkish hopes from BoE prod Pound Sterling sellers.
- Bulls need sustained break of 1.2850 to register further upside.
GBP/USD sellers prod intraday low of around 1.2810 heading into Monday’s London open, printing the first daily loss in five at the highest levels in 14 months.
In doing so, the Cable pair justifies the downside break of a bearish pennant chart formation amid downbeat signals from the MACD and the RSI (14) technical indicators.
That said, the broad US Dollar rebound amid the Juneteenth holiday, as well as backed by the hawkish Fed talks, join the Pound Sterling pair’s consolidation ahead of the Bank of England (BoE) monetary policy meeting to trigger the quote’s latest pullback from the multi-day high.
With this, the GBP/USD sellers are likely to break the 1.2800 round figure. However, a convergence of the 50-Hour Moving Average (HMA) joins two-day-old horizontal support to restrict the pair’s immediate downside near 1.2770-65.
Following that, a one-week-old rising support line and the 200-HMA, respectively near 1.2730 and 1.2600, will be crucial to watch for clear directions.
On the flip side, the Cable pair’s recovery needs validation from the 1.2850 hurdle, marked the last week.
Following that, lows printed in early April 2022 near 1.2970 may check the upside momentum targeting the 1.3000 psychological magnet.
GBP/USD: Hourly chart
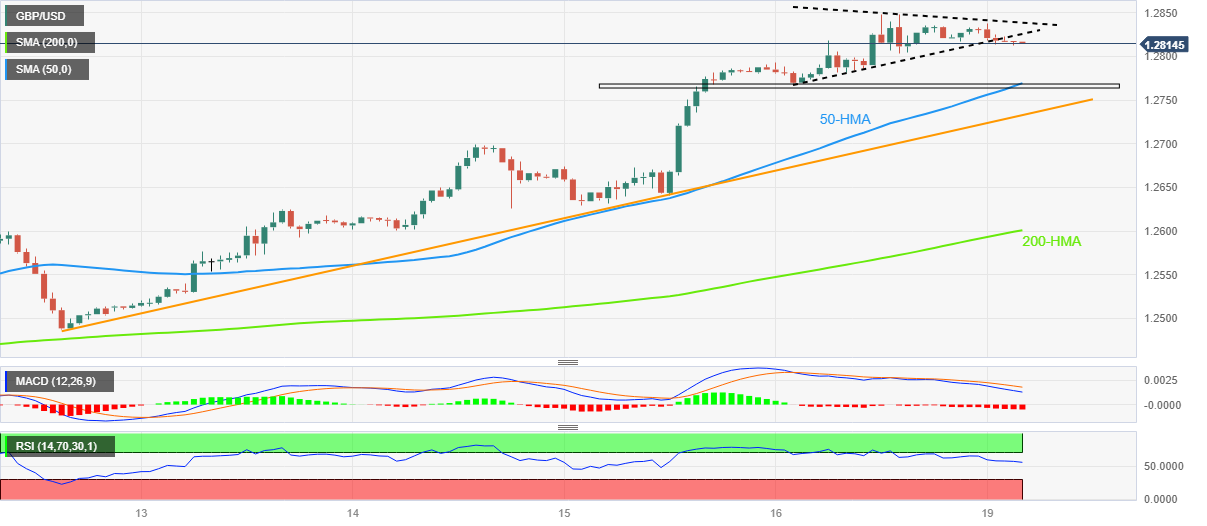
Trend: Pullback expected
ADDITIONAL IMPORTANT LEVELS
| OVERVIEW |
|---|
| Today last price | 1.2817 |
| Today Daily Change | -0.0005 |
| Today Daily Change % | -0.04% |
| Today daily open | 1.2822 |
| TRENDS |
|---|
| Daily SMA20 | 1.2495 |
| Daily SMA50 | 1.2492 |
| Daily SMA100 | 1.2324 |
| Daily SMA200 | 1.2045 |
| LEVELS |
|---|
| Previous Daily High | 1.2848 |
| Previous Daily Low | 1.2768 |
| Previous Weekly High | 1.2848 |
| Previous Weekly Low | 1.2487 |
| Previous Monthly High | 1.268 |
| Previous Monthly Low | 1.2308 |
| Daily Fibonacci 38.2% | 1.2818 |
| Daily Fibonacci 61.8% | 1.2799 |
| Daily Pivot Point S1 | 1.2777 |
| Daily Pivot Point S2 | 1.2733 |
| Daily Pivot Point S3 | 1.2697 |
| Daily Pivot Point R1 | 1.2857 |
| Daily Pivot Point R2 | 1.2893 |
| Daily Pivot Point R3 | 1.2937 |