- EUR/USD pares the biggest daily gains in seven weeks with mild losses.
- Portrays consolidation ahead of German inflation clues, US employment, growth data.
- 100-SMA, 1.5-month-long descending resistance line together challenge Euro buyers.
- Pullback remains elusive beyond ascending trend line from late May.
EUR/USD reverses from weekly top while posting the first daily loss in three around 1.0860 heading into Wednesday’s European session. In doing so, the Euro pair marks the trader’s positioning for today’s top-tier German and the US data while taking a U-turn from a convergence of the 100-SMA and a downward-sloping resistance line from mid-July.
It’s worth noting that the RSI (14) line’s retreat joins the likely easing of the German inflation clues to weigh on the EUR/USD prices.
However, the pullback needs validation from the US data and a three-week-old rising support line, close to 1.0770 to convince the Euro bears. Following that, a slump toward May’s low of around 1.0635 can’t be ruled out.
In a case where the EUR/USD bears keep the reins past 1.0635, the yearly bottom marked in March around 1.0515 will be in the spotlight.
Alternatively, an upside break of the 1.0890 resistance confluence comprising the 100-SMA and a downward-sloping resistance line from July 18 could aim for the previous weekly high of around 1.0930 and the 50% Fibonacci retracement of May-July upside, near 1.0955.
Should the bears remain in control after 1.0955, the 200-SMA level of around 1.0980 and the 1.1000 psychological magnet will be in the spotlight.
EUR/USD: Four-hour chart
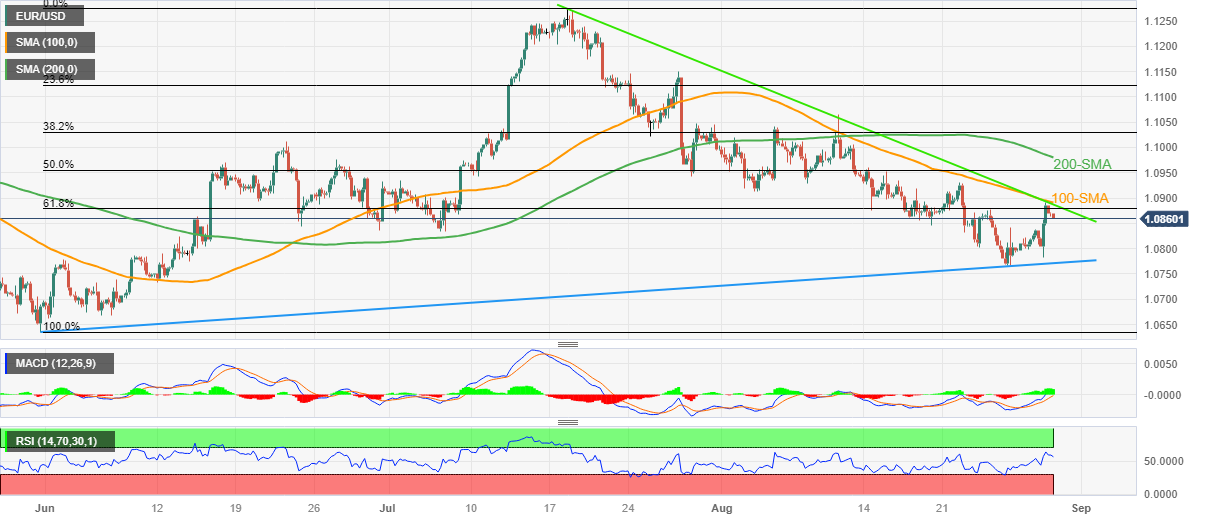
Trend: Pullback expected
ADDITIONAL IMPORTANT LEVELS
| OVERVIEW |
|---|
| Today last price | 1.0861 |
| Today Daily Change | -0.0019 |
| Today Daily Change % | -0.17% |
| Today daily open | 1.088 |
| TRENDS |
|---|
| Daily SMA20 | 1.0905 |
| Daily SMA50 | 1.0974 |
| Daily SMA100 | 1.0927 |
| Daily SMA200 | 1.0809 |
| LEVELS |
|---|
| Previous Daily High | 1.0892 |
| Previous Daily Low | 1.0782 |
| Previous Weekly High | 1.093 |
| Previous Weekly Low | 1.0766 |
| Previous Monthly High | 1.1276 |
| Previous Monthly Low | 1.0834 |
| Daily Fibonacci 38.2% | 1.085 |
| Daily Fibonacci 61.8% | 1.0824 |
| Daily Pivot Point S1 | 1.0811 |
| Daily Pivot Point S2 | 1.0742 |
| Daily Pivot Point S3 | 1.0701 |
| Daily Pivot Point R1 | 1.092 |
| Daily Pivot Point R2 | 1.0961 |
| Daily Pivot Point R3 | 1.103 |