- SD bulls are in the market but face a wall of resistance.
- EUR/USD bears eye the 4-hour W-formation and a move into test key support.
EUR/USD traded higher Friday as the US Dollar bears pounced on data that inflation showed further signs of cooling in June according to Personal Consumption Expenditure data. However, the DXY was still set for the second straight week of gains, underpinned by stronger-than-expected US economic data.
Nevertheless, EUR/USD was headed towards the close on Wall Street higher by some 0.43% after moving up from a low of 1.0943 to score a high of 1.1047 on the day. Technically, though, the rally off the May monthly low appears vulnerable, and unless key US data next week cooperates longs could be in for a squeeze as the following illustrates:
EUR/USD daily chart, bearish
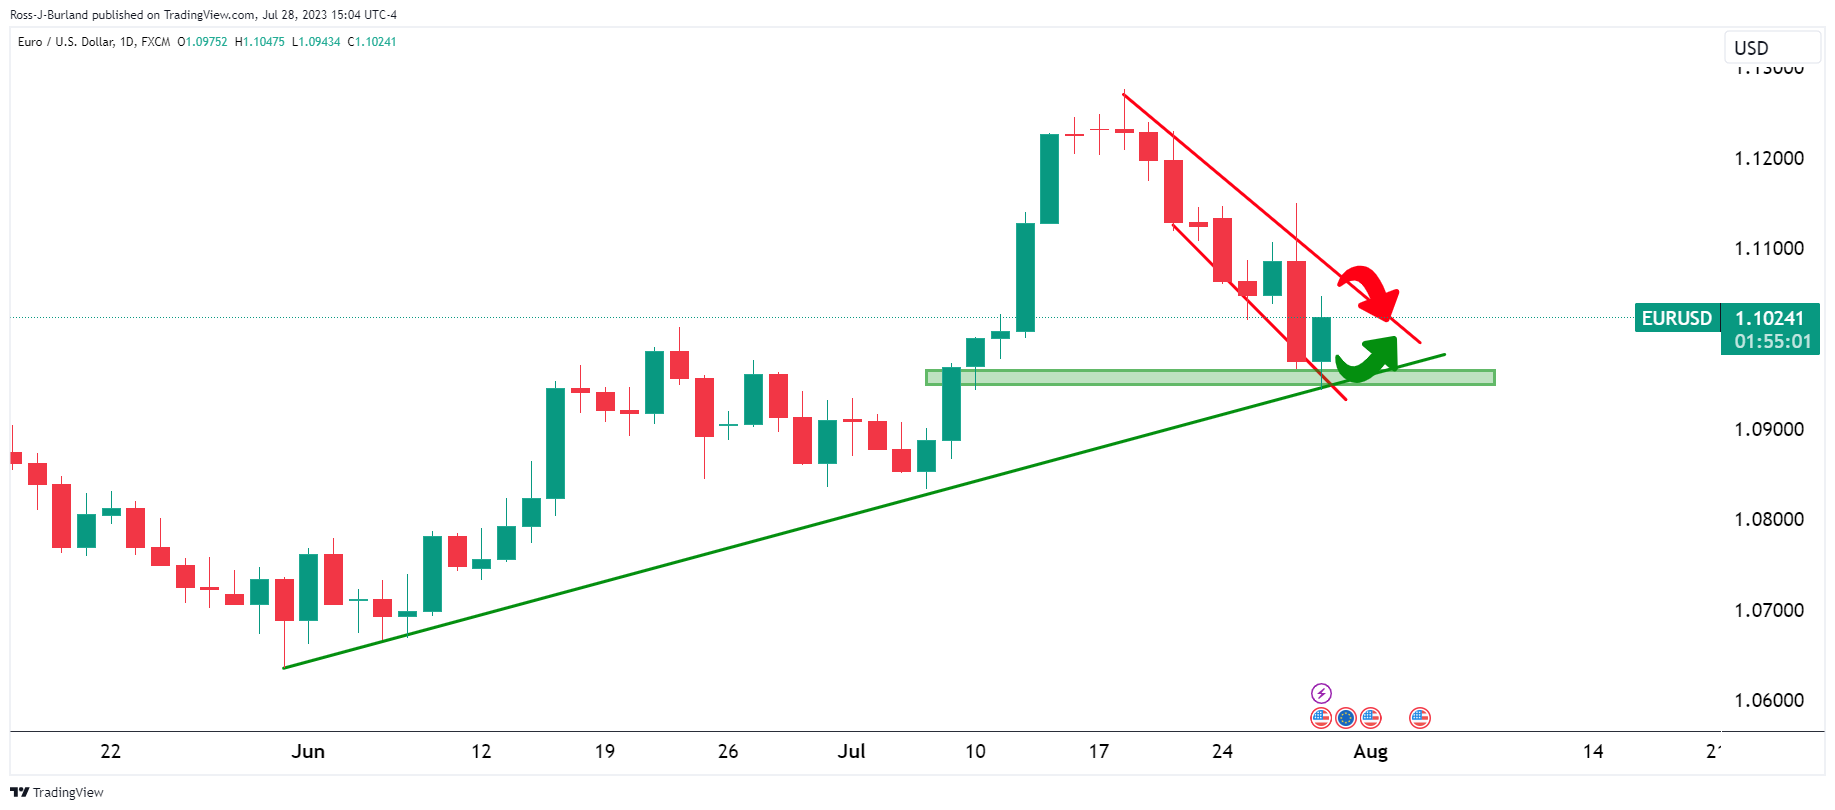
Bulls are in the market within a down channel and front side of the bullish trend. However…
EUR/USD daily chart Fibonacci resistance
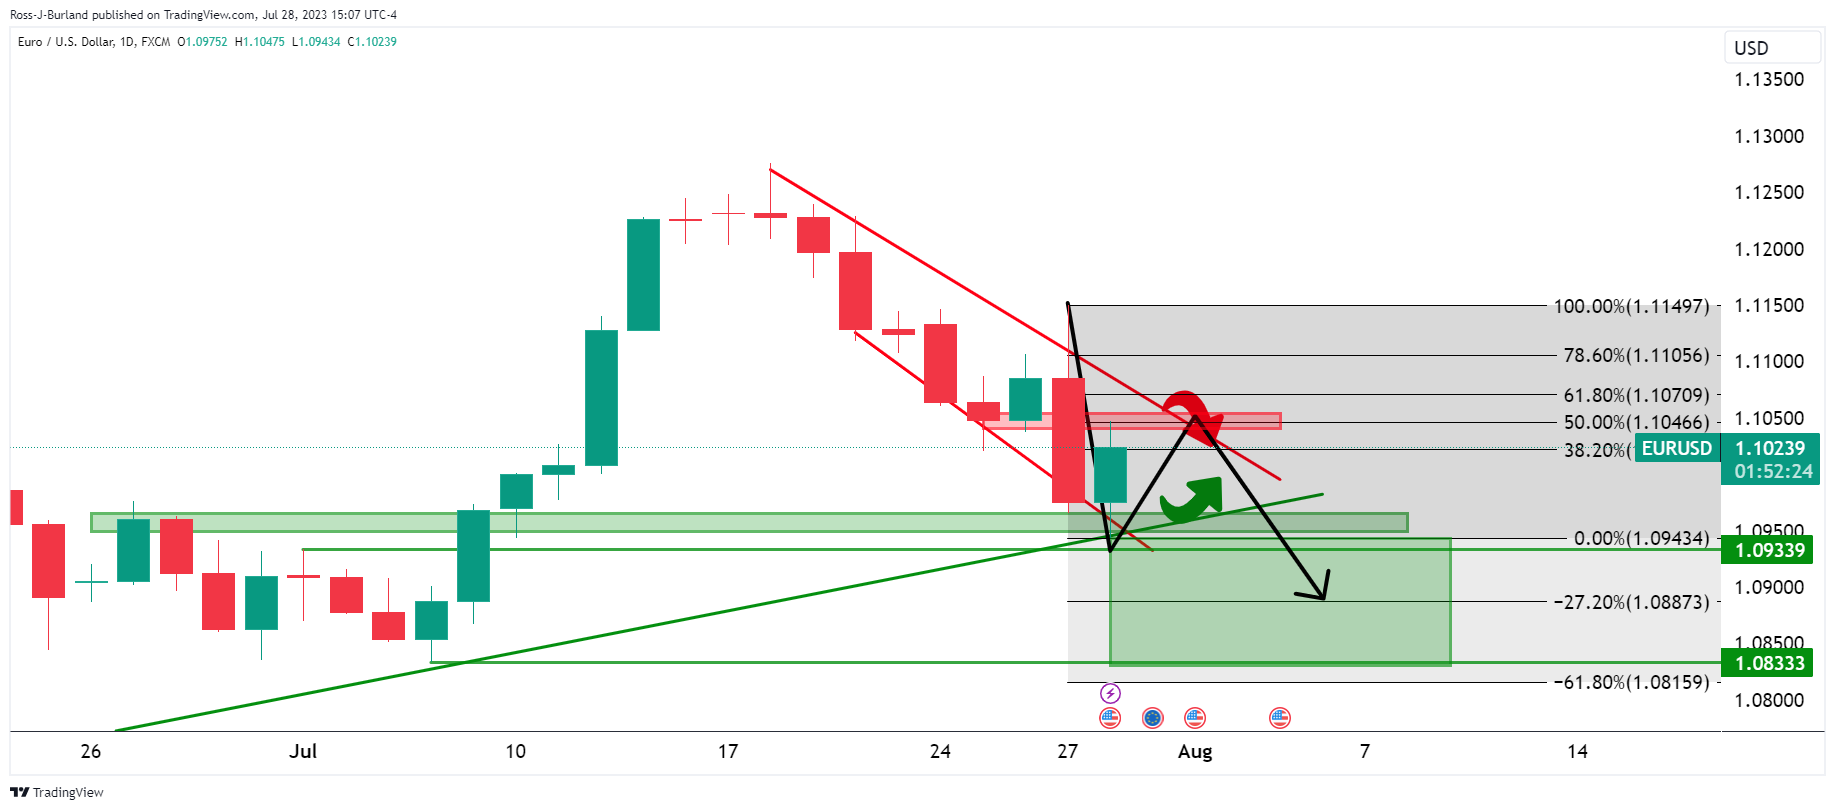
We have horizontal resistance and trendline resistance that meet at a key level within the Fibonacci scale. 1.0710 at a 61.8% ratio could be a tough nut to crack.
EUR/USD H4 chart
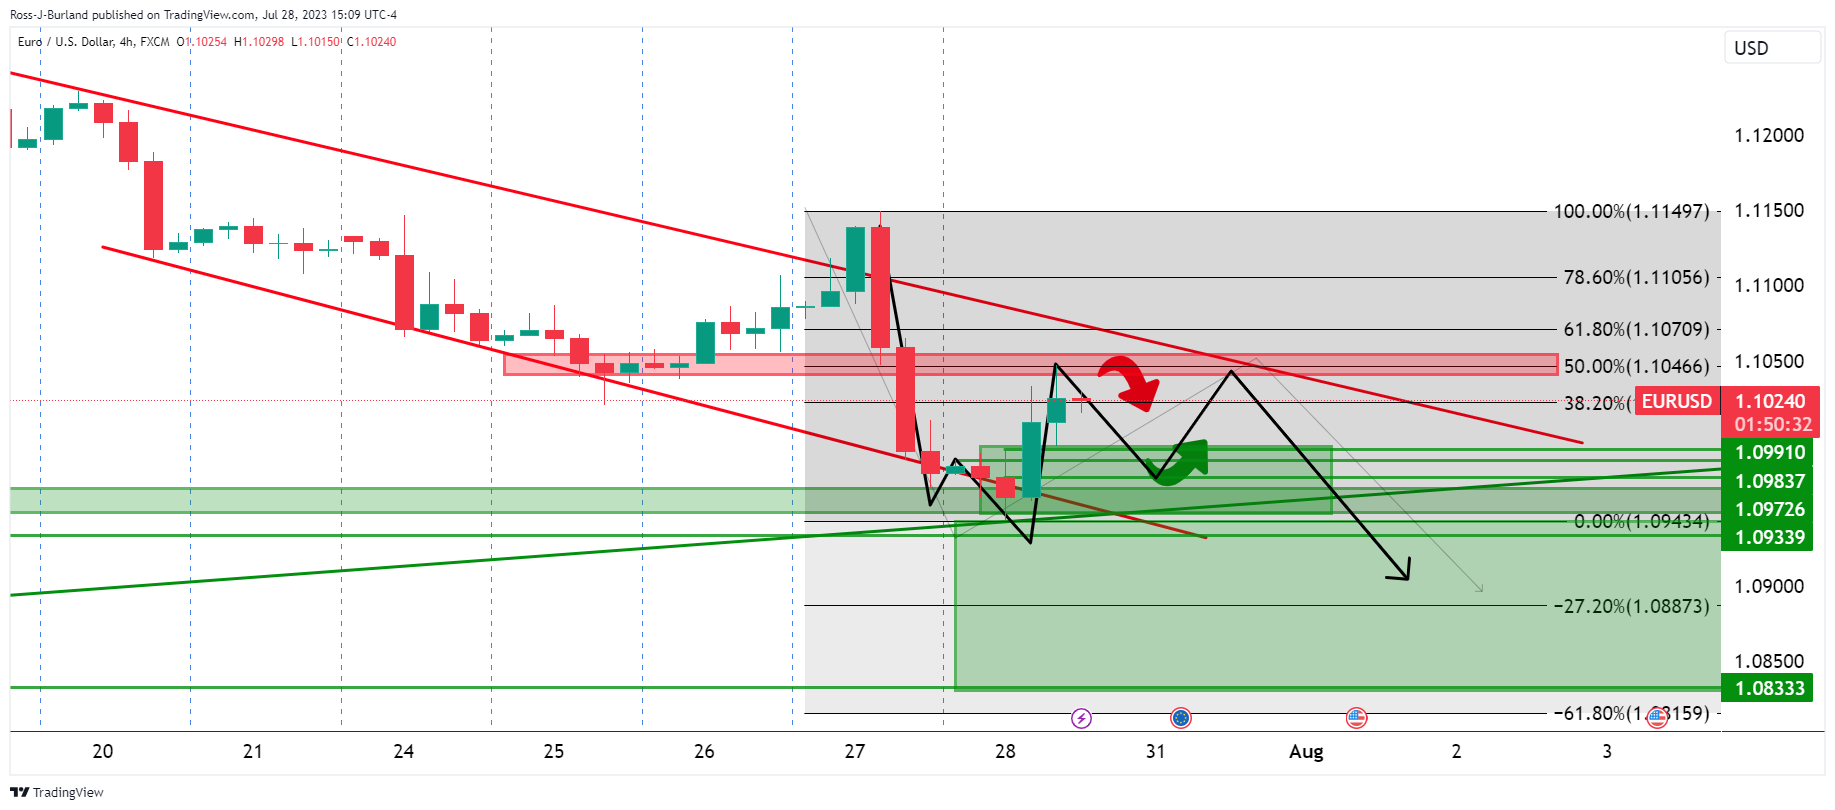
Meanwhile, the 4-hour chart’s W-formation is troublesome and could be a pull on the price for the near future.