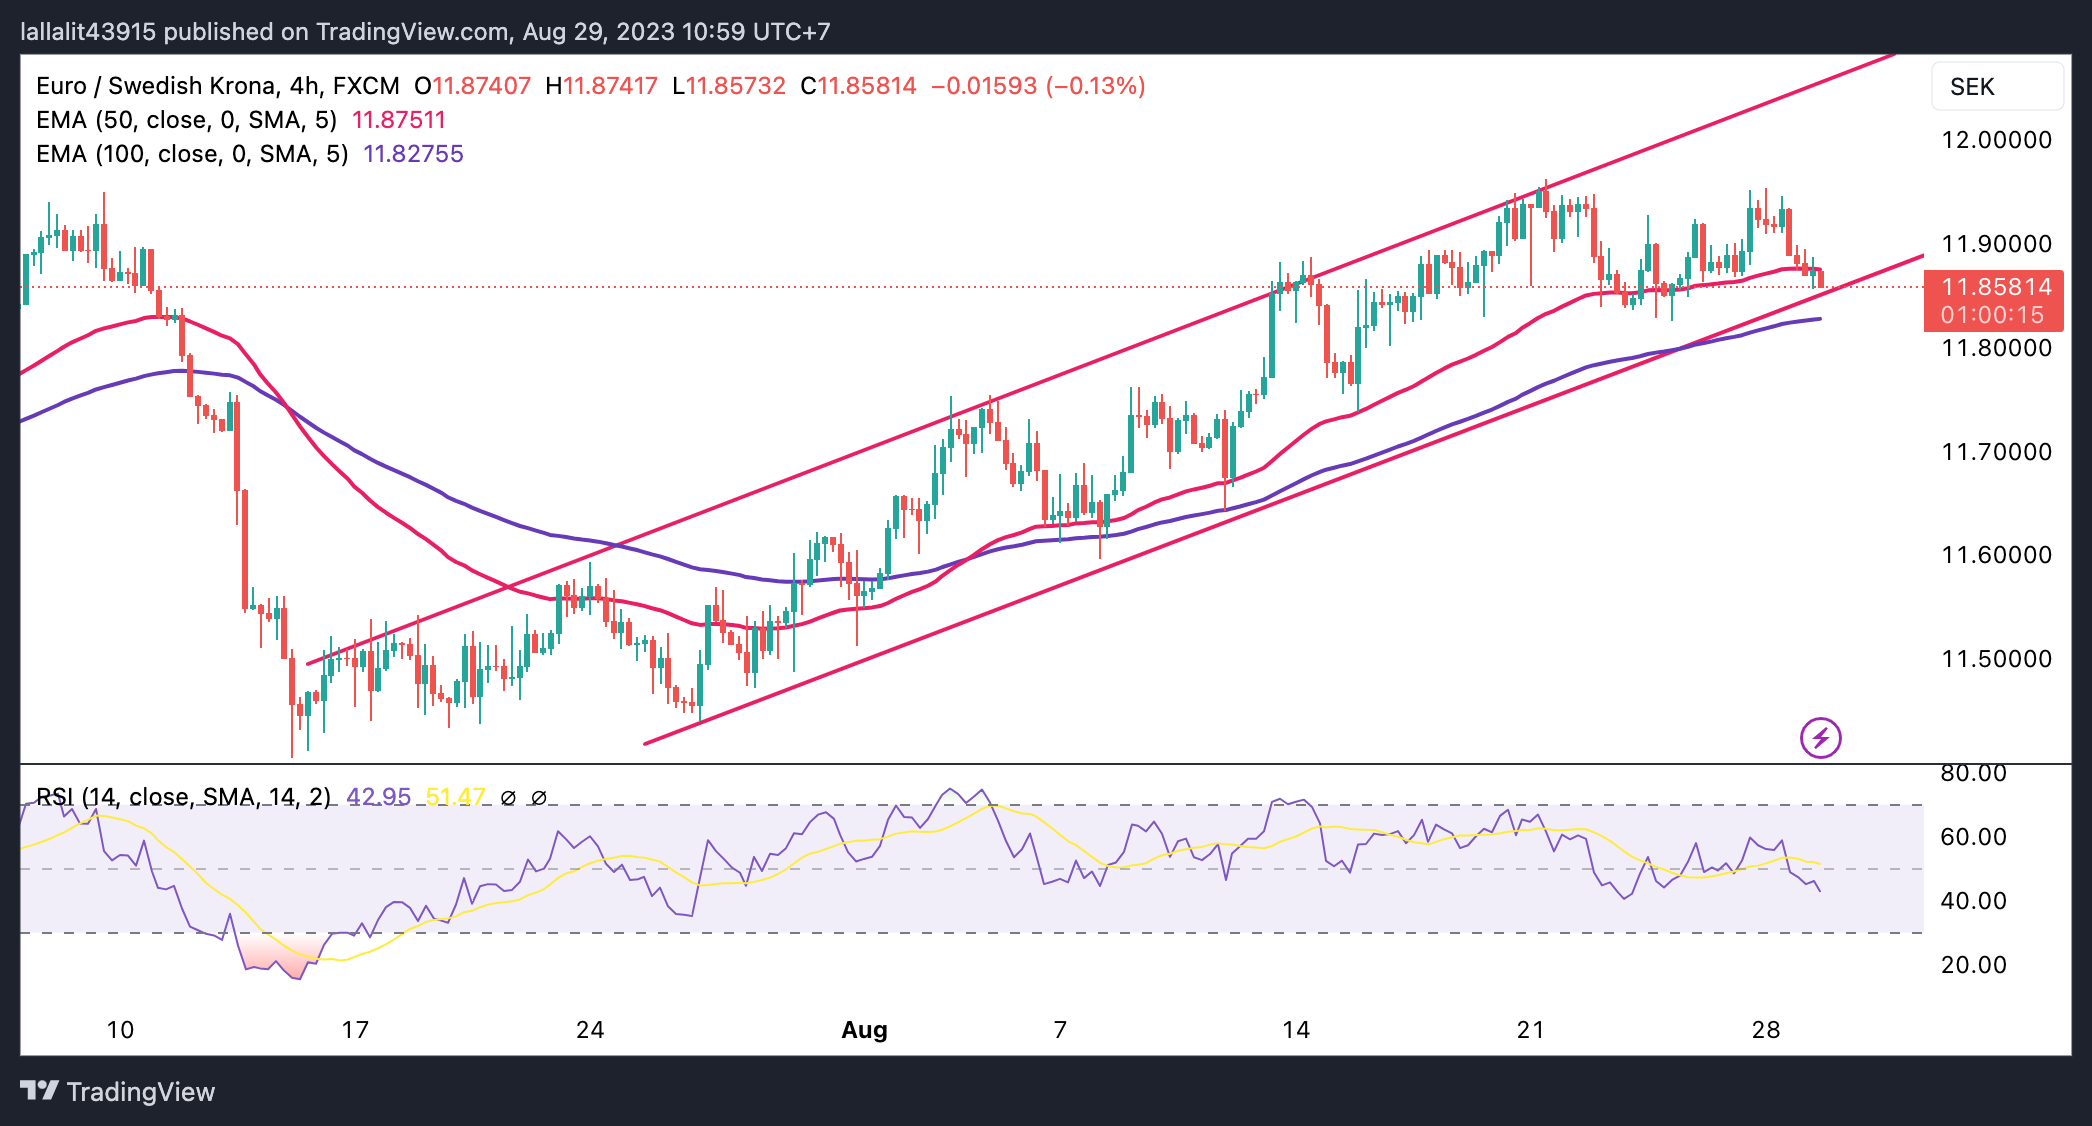
- EUR/SEK trades within the ascending trend-channel on the four-hour chart.
- The key support level is seen at 11.8550; 11.8752 acts as an immediate resistance level for the cross.
- The Relative Strength Index (RSI) stands in bearish territory below 50.
The EUR/SEK cross loses traction after retreating from a weekly high of 1.9455 during the Asian session on Tuesday. The cross currently trades near 11.8577, down 0.19% on the day.
From the technical perspective, EUR/SEK trades within the ascending trend-channel since the middle of July on the four-hour chart. Additionally, the cross holds above the key 100-hour Exponential Moving Average (EMA), which means the further upside looks favorable for the time being.
That said, the key support level for EUR/SEK is seen at 11.8550, representing the lower limit of the ascending trend-channel. A decisive break below the latter will see a drop to 11.8255 (a low of August 24). The next contention level will emerge at 11.8275 (100-hour EMA). The additional downside filter is located at 11.7375 (a low of August 15).
On the upside, the 50-hour EMA at 11.8752 acts as an immediate resistance level for the cross, en route to 11.9235 (a high of August 24). The next upside stop to watch is 11.9500 (a high of July 7). The key barrier for EUR/SEK is located at 11.9625, representing a Year-To-Date (YTD) high. Any meaningful follow-through buying above the latter will see a rally to the next critical area at 12.00. The mentioned level portrays a psychological round figure and the upper boundary of the ascending trend-channel.
It’s worth noting that the Relative Strength Index (RSI) stands in bearish territory below 50, indicating the path of least resistance seems lower for now.
EUR/SEK four-hour chart
EUR/SEK
| OVERVIEW |
|---|
| Today last price | 11.8609 |
| Today Daily Change | -0.0228 |
| Today Daily Change % | -0.19 |
| Today daily open | 11.8837 |
| TRENDS |
|---|
| Daily SMA20 | 11.7984 |
| Daily SMA50 | 11.7207 |
| Daily SMA100 | 11.5789 |
| Daily SMA200 | 11.3626 |
| LEVELS |
|---|
| Previous Daily High | 11.9664 |
| Previous Daily Low | 11.8747 |
| Previous Weekly High | 11.9646 |
| Previous Weekly Low | 11.7798 |
| Previous Monthly High | 11.9542 |
| Previous Monthly Low | 11.2825 |
| Daily Fibonacci 38.2% | 11.9098 |
| Daily Fibonacci 61.8% | 11.9314 |
| Daily Pivot Point S1 | 11.8501 |
| Daily Pivot Point S2 | 11.8166 |
| Daily Pivot Point S3 | 11.7584 |
| Daily Pivot Point R1 | 11.9419 |
| Daily Pivot Point R2 | 12 |
| Daily Pivot Point R3 | 12.0336 |