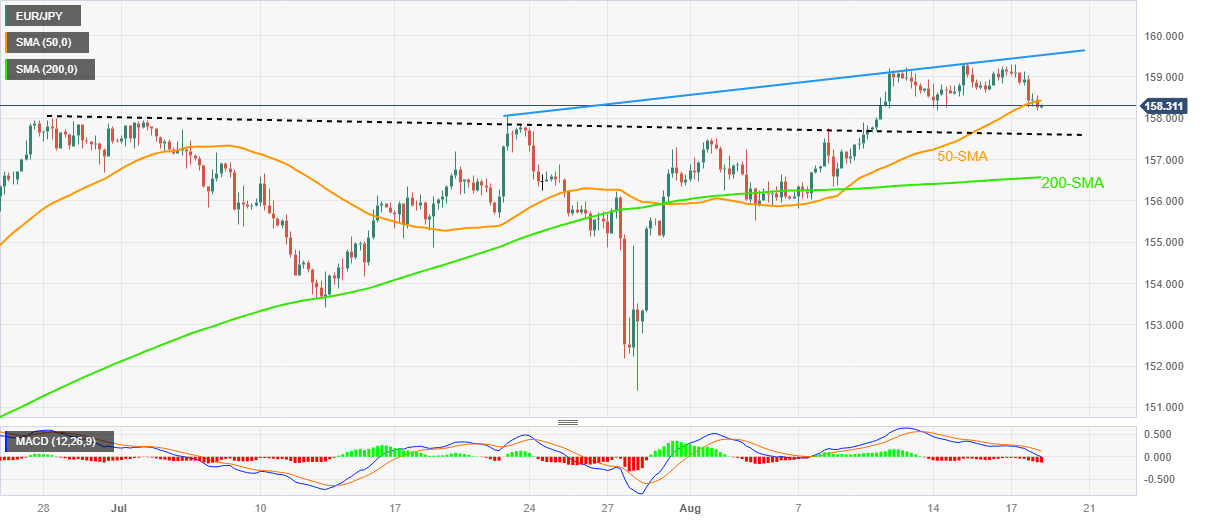
- EUR/JPY remains on back foot at weekly low, lacks momentum of late.
- Clear break of 50-SMA, U-turn from ascending trend line and bearish MACD signals lure sellers.
- Retreat in yields, firmer Japan inflation add strength to the pullback moves.
- Seven-week-old previous resistance line prods cross-currency sellers ahead of 200-SMA support.
EUR/JPY holds lower ground at the intraday bottom of around 158.20 heading into Friday’s European session. In doing so, the cross-currency pair takes clues from the recent pullback in the Treasury bond yields, as well as upbeat prints of Japan’s inflation data, amid a sluggish trading day.
However, the pair’s clear U-turn from a three-week-old rising trend line and the bearish MACD signals, as well as a downside break of the 50-SMA, gain major attention to keep the sellers hopeful.
It’s worth noting that the previous resistance line from late June restricts the immediate downside of the EUR/JPY pair to around 157.60.
Following that, the 200-SMA level surrounding 156.55 will act as the final defense of the EUR/JPY buyers.
In a case where the quote remains bearish past 156.55, multiple supports around 155.50 and 153.40 may prod the sellers before directing them to the previous monthly low of around 151.40.
On the contrary, a clear upside break of the 50-SMA level of 158.45 becomes necessary for the EUR/JPY buyer’s return.
Even so, an ascending trend line from July 21, close to 159.55, quickly followed by the 160.00 round figure, will challenge the EUR/JPY bulls afterward.
EUR/JPY: Four-hour chart

Trend: Further downside expected
ADDITIONAL IMPORTANT LEVELS
| OVERVIEW |
|---|
| Today last price | 158.28 |
| Today Daily Change | -0.28 |
| Today Daily Change % | -0.18% |
| Today daily open | 158.56 |
| TRENDS |
|---|
| Daily SMA20 | 157.09 |
| Daily SMA50 | 156.06 |
| Daily SMA100 | 152 |
| Daily SMA200 | 147.27 |
| LEVELS |
|---|
| Previous Daily High | 159.3 |
| Previous Daily Low | 158.26 |
| Previous Weekly High | 159.22 |
| Previous Weekly Low | 155.81 |
| Previous Monthly High | 158.05 |
| Previous Monthly Low | 151.41 |
| Daily Fibonacci 38.2% | 158.65 |
| Daily Fibonacci 61.8% | 158.9 |
| Daily Pivot Point S1 | 158.11 |
| Daily Pivot Point S2 | 157.66 |
| Daily Pivot Point S3 | 157.07 |
| Daily Pivot Point R1 | 159.16 |
| Daily Pivot Point R2 | 159.75 |
| Daily Pivot Point R3 | 160.2 |