- EUR/GBP remains on the back foot at weekly low during four-day losing streak, holds lower ground of late.
- Oversold RSI (14) conditions, pre-ECB anxiety check pair sellers targeting six-week-old horizontal support.
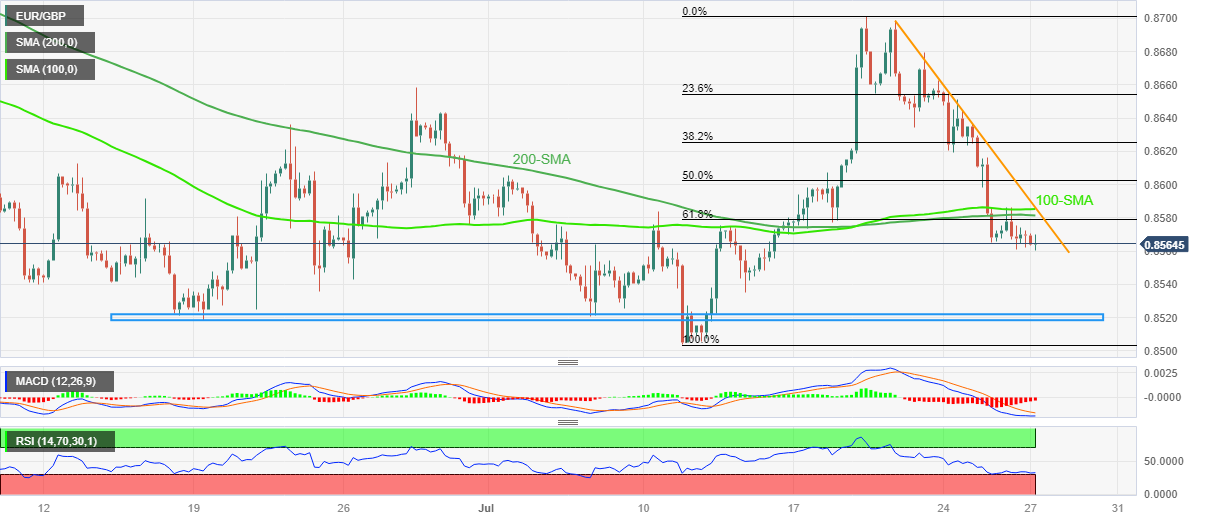
- Intraday buyers need validation from 0.8585 to retake control.
EUR/GBP languishes near the weekly low surrounding 0.8560 as bears struggle ahead of Thursday’s all-important European Central Bank (ECB) monetary policy decision. Even so, the cross-currency pair remains bearish for the fourth consecutive day, poking the lowest level since July 14 of late.
It should be noted that the pre-ECB consolidation joins the oversold conditions of the Relative Strength Index (RSI) line, placed at 14, to challenge the EUR/GBP bears. However, the bearish MACD signals join dovish expectations from the ECB, despite a likely 0.25% rate hike, to keep the sellers hopeful.
Also favoring the EUR/GBP bears is the pair’s inability to cross the key moving averages during early Wednesday’s corrective bounce.
With this, the cross-currency pair appears well set to test the 10-week-old horizontal support zone surrounding 0.8520. However, the 11-month low near 0.8500, marked earlier in July, could test the EUR/GBP bears afterward.
In a case where the quote remains bearish past 0.8500, it becomes vulnerable to drop toward the February 2022 peak of near 0.8475.
On the flip side, the 200-SMA level of 0.8580 guards the immediate upside of the EUR/GBP pair ahead of the convergence of the 100-SMA and one-week-old descending resistance line, close to 0.8585 by the press time.
Following that, the quote may aim for the tops marked on June 22 and 28, respectively near 0.8635 and 0.8660, before challenging the monthly top of 0.8700.
EUR/GBP: Four-hour chart
Trend: Limited downside expected
ADDITIONAL IMPORTANT LEVELS
| OVERVIEW |
|---|
| Today last price | 0.8565 |
| Today Daily Change | -0.0001 |
| Today Daily Change % | -0.01% |
| Today daily open | 0.8566 |
| TRENDS |
|---|
| Daily SMA20 | 0.8584 |
| Daily SMA50 | 0.86 |
| Daily SMA100 | 0.8693 |
| Daily SMA200 | 0.8728 |
| LEVELS |
|---|
| Previous Daily High | 0.8586 |
| Previous Daily Low | 0.8561 |
| Previous Weekly High | 0.8701 |
| Previous Weekly Low | 0.857 |
| Previous Monthly High | 0.8658 |
| Previous Monthly Low | 0.8518 |
| Daily Fibonacci 38.2% | 0.8571 |
| Daily Fibonacci 61.8% | 0.8577 |
| Daily Pivot Point S1 | 0.8556 |
| Daily Pivot Point S2 | 0.8546 |
| Daily Pivot Point S3 | 0.853 |
| Daily Pivot Point R1 | 0.8582 |
| Daily Pivot Point R2 | 0.8597 |
| Daily Pivot Point R3 | 0.8607 |