- AUD/USD consolidates the first weekly gain in seven within fortnight-long bullish channel.
- Pre-NFP positioning allows Aussie buyers to take a breather.
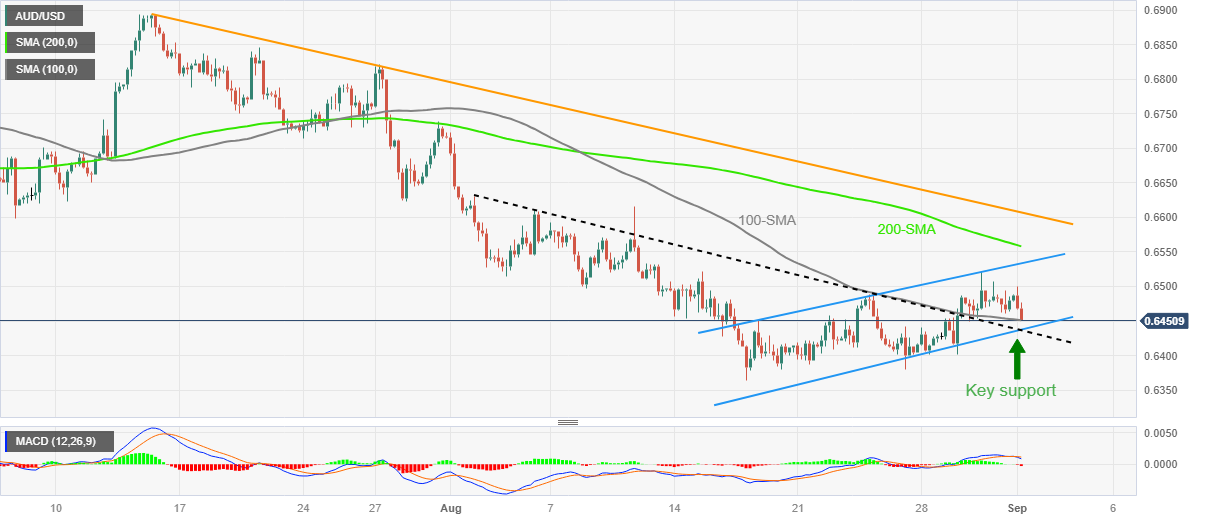
- 100-SMA restricts immediate downside ahead of channel’s bottom line, resistance-turned-support trend line.
- Bulls should remain cautious below 1.5-month-old descending resistance line.
AUD/USD pares the weekly gains as markets brace for US employment data for August on early Friday.
In doing so, the Aussie pair not only portrays the cautious mood ahead of the key data/events but also justifies the bearish MACD signals.
With this, the AUD/USD pair is likely to extend the latest weakness towards paring the first weekly run-up in seven. However, a convergence of the two-week-old rising trend channel’s bottom line joins the previous resistance line from mid-July, close to 0.6440-35, challenges the AUD/USD pair sellers.
In a case where the Aussie pair remains bearish past 0.6435, the 0.6400 round figure and the previous monthly low of around 0.6365 will act as the final defense of the bulls.
On the contrary, the stated channel’s top line restricts immediate recovery of the AUD/USD pair around 0.6540. Following that, the 200-SMA can act as an additional check for the Aussie pair buyers.
It’s worth noting, however, that a downward-sloping resistance line from July 14, close to 0.6610 by the press time, appears crucial to break for the AUD/USD buyers.
To sum up, AUD/USD fade the early-day strength, previously backed by China data and stimulus, as market players await the August month US jobs report.
AUD/USD: Four-hour chart
Trend: Limited downside expected
ADDITIONAL IMPORTANT LEVELS
| OVERVIEW |
|---|
| Today last price | 0.6467 |
| Today Daily Change | -0.0017 |
| Today Daily Change % | -0.26% |
| Today daily open | 0.6484 |
| TRENDS |
|---|
| Daily SMA20 | 0.6471 |
| Daily SMA50 | 0.6611 |
| Daily SMA100 | 0.6646 |
| Daily SMA200 | 0.6723 |
| LEVELS |
|---|
| Previous Daily High | 0.6508 |
| Previous Daily Low | 0.6461 |
| Previous Weekly High | 0.6488 |
| Previous Weekly Low | 0.638 |
| Previous Monthly High | 0.6724 |
| Previous Monthly Low | 0.6364 |
| Daily Fibonacci 38.2% | 0.649 |
| Daily Fibonacci 61.8% | 0.6479 |
| Daily Pivot Point S1 | 0.6461 |
| Daily Pivot Point S2 | 0.6438 |
| Daily Pivot Point S3 | 0.6414 |
| Daily Pivot Point R1 | 0.6508 |
| Daily Pivot Point R2 | 0.6531 |
| Daily Pivot Point R3 | 0.6555 |